First Web-based GIS exercises: http://map.sdsu.edu/geog104/ex-1.html
(Due day: February 8 before the class 2pm. Submit the electronic version in blackboard).
Unit 2.1
Mapping the Earth
The Article from Nature (Reading Assignment.).
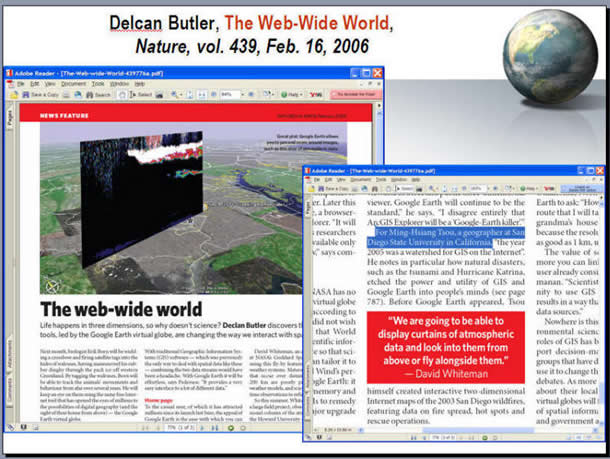
Declan Butler, (2006). The web-wide world. Nature, 439(16). February 2006, pp. 776-778.
Discussion:
What is the most important message you learned from this article?
WHO said "Just as the PC democratized computing, so systems like Google Earth will democratize GIS." in this article? (hint: www.geog.ucsb.edu )
WHO is Jack Dangermond? What's the name of his company? (www.esri.com)
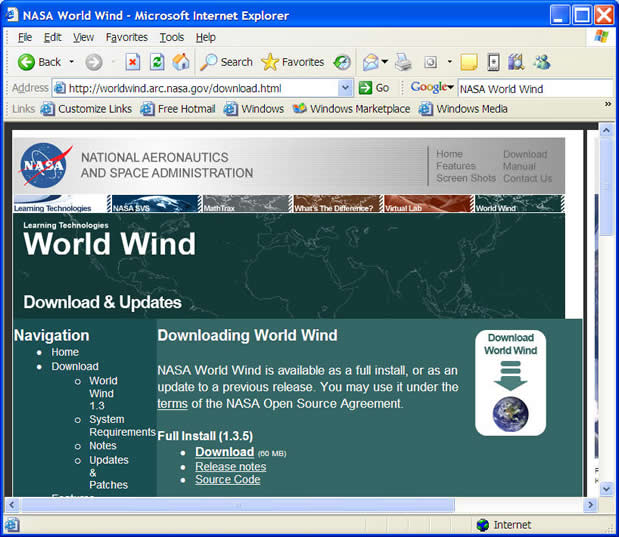
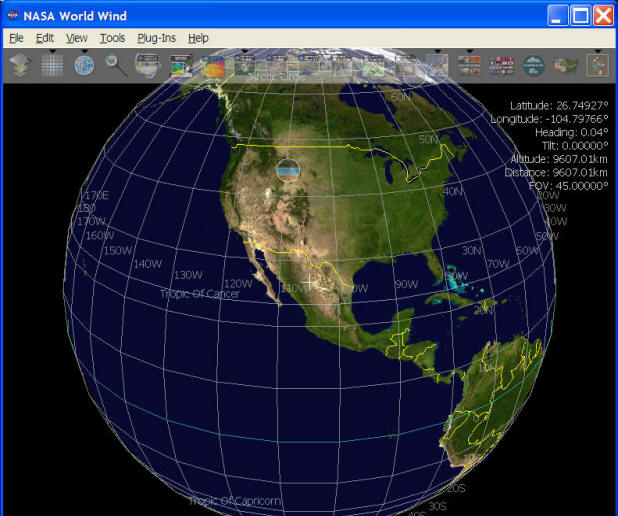
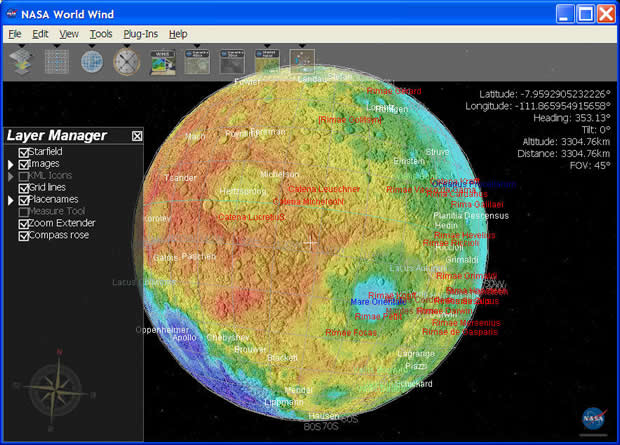
What is the NASA World Wind? http://worldwind.arc.nasa.gov/
Digital Earth
The concept of digital earth is formalized from the former Vice President Al Gore of the United States who delivered a speech entitled "The Digital Earth: Understanding our planet in the 21st Century" at California Science Center, Los Angeles, on January 31, 1998.
http://www.tandfonline.com/doi/abs/10.1080/00050348.1998.10558728
Imagine, for example, a young child going to a Digital Earth exhibit at a local museum. After donning a head-mounted display, she sees Earth as it appears from space. Using a data glove, she zooms in, using higher and higher levels of resolution, to see continents, then regions, countries, cities, and finally individual houses, trees, and other natural and man-made objects. Having found an area of the planet she is interested in exploring, she takes the equivalent of a "magic carpet ride" through a 3-D visualization of the terrain. Of course, terrain is only one of the many kinds of data with which she can interact. Using the systems’ voice recognition capabilities, she is able to request information on land cover, distribution of plant and animal species, realtime weather, roads, political boundaries, and population. She can also visualize the environmental information that she and other students all over the world have collected as part of the GLOBE project. This information can be seamlessly fused with the digital map or terrain data. She can get more information on many of the objects she sees by using her data glove to click on a hyperlink.
Maps are the representation of our Earth
(or can we map other Planets?)...
What is Representation?
A model used to convey informatoin
Why [Representation]?
By building representations, we humans can assemble far more knowledge about our planet than we ever could as individuals.
(Examples: Mathematics.. abstraction/representation --> 2 + 2 = 4 )
http://www.youtube.com/watch?feature=player_detailpage&v=xSi0lfl-31U
What is a Map?
Maps are generalized representation of real or imagined environments.
(for more information, see GEOG 381 Computerized Map Design http://map.sdsu.edu/geog381/ )
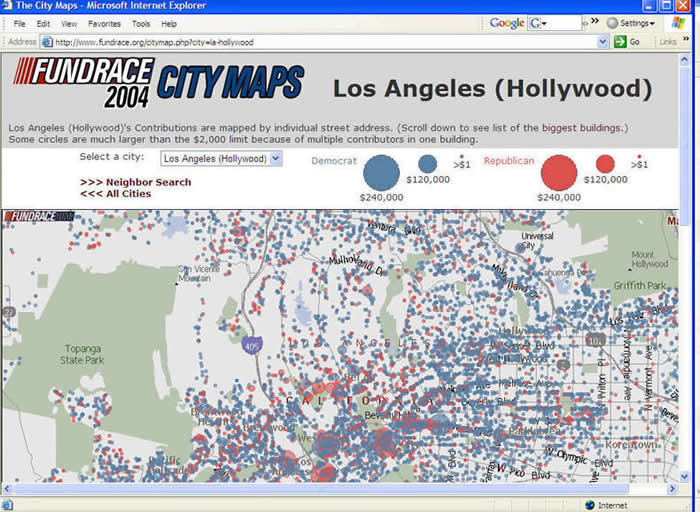
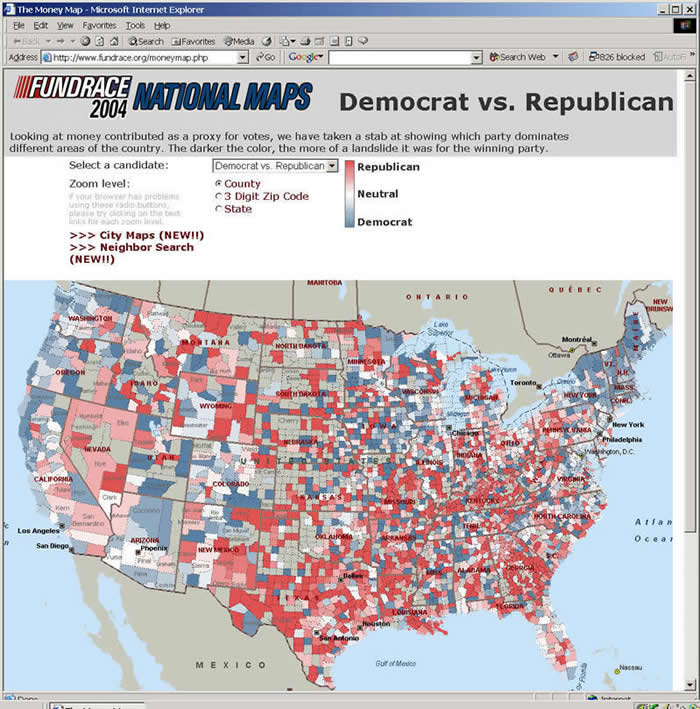
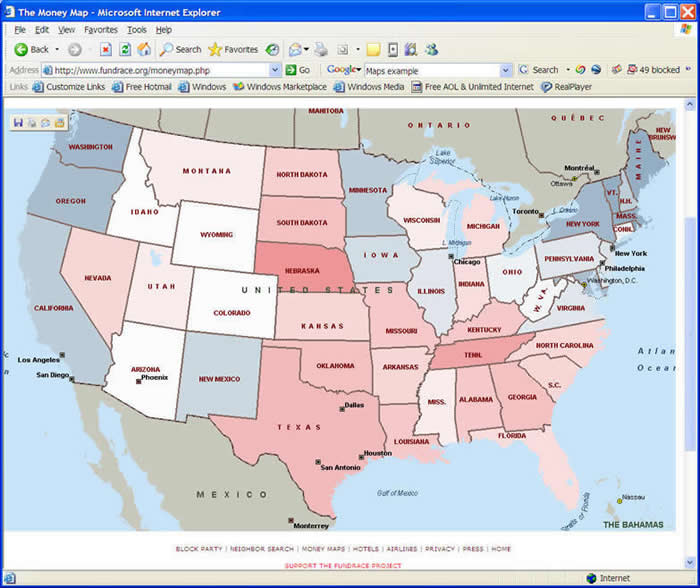
(How many people donate their moneys for political campaign in U.S. ? How can we generalize these information into maps?)
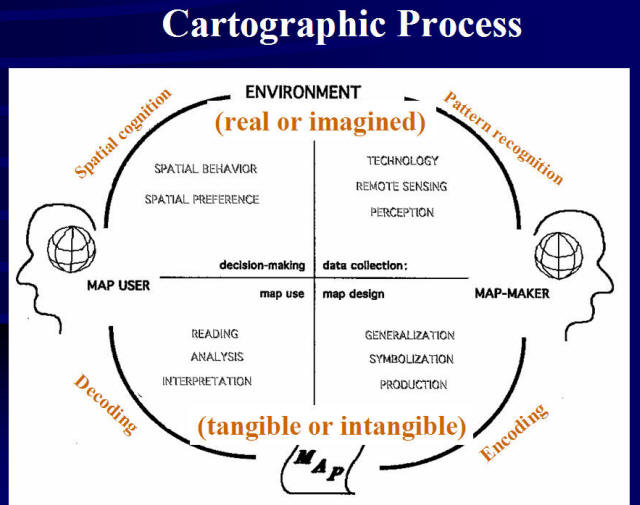
What is Cartography?
Cartography is about Maps.
Map is digital or analog output from a GIS showing information using well establsiehd catrogrphic conventions.
The four steps of cartographic process are:
- Data Collection
- Map Design
- Map Use
- Decision Making
Modern Cartography is emphasizing on Digital Representation and Computerized Map Design.
Digital Representation: Data and information stored in a binary form in computers.
Data Models: Structures and rules programmed into a GIS to accommodate data
Representation in digital form (textbook 3.2).
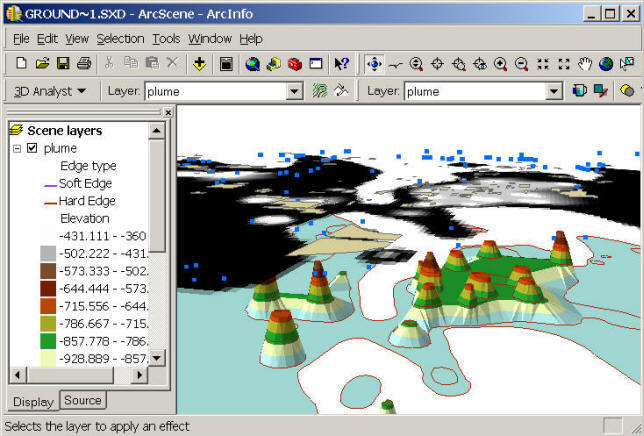
Digital Map Examples: TRUE 3D symbols and objects (Three-dimensional):
- Any point on the surface is specified by four variables (X, Y, Z, and the values).
- 3D maps (usually mixed up with 2 1/2 maps)
- Underground water quality
- CO2 level in the atmosphere
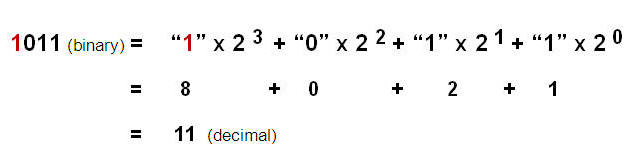
The Binary Counting System (The Foundation of Digital Representation)
Decimal, Binary, Octal, & Hexadecimal....
http://www.youtube.com/user/MyWhyU?v=5sS7w-CMHkU&feature=pyv
The binary counting system uses only two symbols, 0 and 1, to represent numerical information.
http://en.wikipedia.org/wiki/Binary_numeral_system
Examples: 01101001001 (binary system) = 841 (decimal system)
1111 = 15 (decimal)
0000 = 0 (decimal)
0010 = ?
0011 = ?
More information: http://www.cut-the-knot.org/do_you_know/BinaryHistory.shtml
You can buy a "LED binary clock.
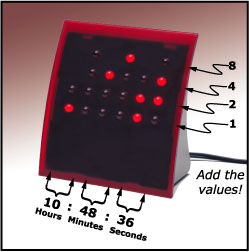
(image source: http://stealthytech.com/200701/led-binary-clock/)
What time is it? (Binary Clock)
http://www.glassgiant.com/geek/binaryclock/
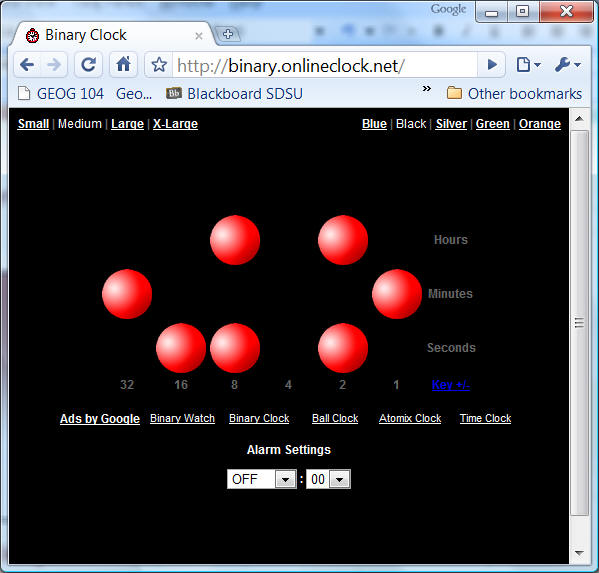
What time is this clock? (different format).
http://binary.onlineclock.net/ (or watch it online).
In a computer, the binary number systems was used for storing variables.
█ = one bit system (possible value : 0 or 1)
█ █ = two bits system (possible value: 00, 01, 10, 11) = decimal value (0, 1, 2, 3)
█ █ █ █ = four bits system = possible value : 0000 -- 1111 (from 0 to 15) = 16 different values
█ █ █ █ █ █ █ █ = 8 bits = ONE BYTE (byte) = 00000000 - 11111111 (from 0 - 255)
This is the most common values range from a computer system, such as color arrangement, IP address:
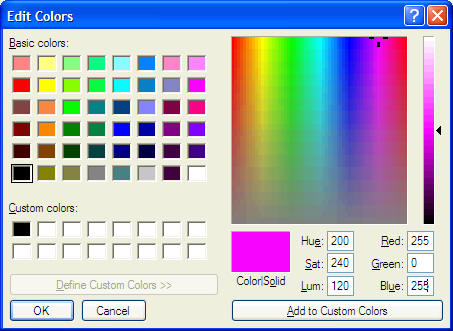
Microsoft Painter Example.
(Tools to convert between Decimal systems and Binary systems)
http://www.cut-the-knot.org/binary.shtml
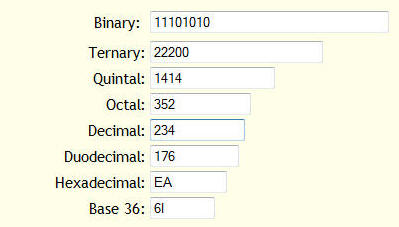
hexadecimal system, or simply hex, is a numeral system with a radix or base of 16 usually written using the symbols 0-9 and A-F or a-f. (http://en.wikipedia.org/wiki/Hexadecimal )
| Hex | Bin | Dec |
|---|---|---|
| 0 | 0000 | 0 |
| 1 | 0001 | 1 |
| 2 | 0010 | 2 |
| 3 | 0011 | 3 |
| 4 | 0100 | 4 |
| 5 | 0101 | 5 |
| 6 | 0110 | 6 |
| 7 | 0111 | 7 |
| 8 | 1000 | 8 |
| 9 | 1001 | 9 |
| A | 1010 | 10 |
| B | 1011 | 11 |
| C | 1100 | 12 |
| D | 1101 | 13 |
| E | 1110 | 14 |
| F | 1111 | 15 |
Example: 0F (hex systems) = 15 (decimal systems)
1A (Hex systems) = 16 (1) + 10 (A) = 26 (decimal systems).
11 (Hex systems) = 16 + 1 = 17 (decimal systems).
FFFF = 1111111111111111 (binary = 16 bits = two bytes)
█ █ (hex system) = 8 bits = one byte (e.g. FF = 1111 1111)
Web page color systems (HTML) use Hex systems for color mapping
http://www.w3schools.com/html/html_colornames.asp
Byte 1: red value
Byte 2: green value
Byte 3: blue value
█ █ █ █ █ █ (R, G, B)
Blue = 00,00,FF
Color |
Hex |
Color |
Hex |
Color |
Hex |
Color |
Hex |
| aqua | #00ffff | black | #000000 | blue | #0000ff | fuchsia | #ff00ff |
| gray | #808080 | green | #008000 | lime | #00ff00 | maroon | #800000 |
| navy | #000080 | olive | #808000 | purple | #800080 | red | #ff0000 |
| silver | #c0c0c0 | teal | #008080 | white | #ffffff | yellow | #ffff00 |
Example in HTML page : http://map.sdsu.edu/geog104/index.html
| <font size="4" color="#FF0000" face="Arial">(GEOG 104) (A General Education [GE] Course)</font></span></strong></p> | |
http://www.utexas.edu/learn/html/colors.html
What is "Information Theory"?
https://www.youtube.com/watch?v=p0ASFxKS9sg
ASCII code (American Standard Code for Information Interchange). (7 bits code, vs. 8 bits code) http://en.wikipedia.org/wiki/ASCII
ASCII 7bit ( http://www.neurophys.wisc.edu/comp/docs/ascii/ )
ASCII 8bit ( http://www.asciitable.com/)
|
|
Display "Hello" in ASCII format:
48 (H) 65 (e) 6C (l) 6C (l) 6F (o) = 48 - 65 - 6C - 6C - 6F
On-line converter = http://www.mikezilla.com/exp0012.html
(Try to enter [Hello] in the Google Search Engine. What happen?) www.google.com
Unicode
Another Coding system: Unicode is an industry standard designed to allow text and symbols from all of the writing systems of the world to be consistently represented and manipulated by computers.
(16bit = 2byte = 65,536)
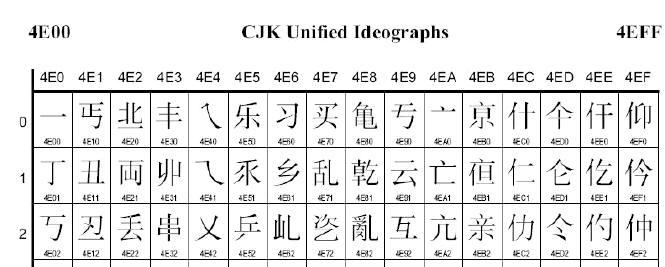
http://en.wikipedia.org/wiki/List_of_CJK_Unified_Ideographs_(4E00-62FF) (then switch the encoding method in your web browser. What happen?) (CJK is a collective term for Chinese, Janapanese, and Korean)
Different number/storage systems in computers:
Java Language Examples
Number Class (http://docs.oracle.com/javase/tutorial/java/data/numberclasses.html)
Subclasses of the number class:
- byte: an 8-bit signed two's complement integer. (-128 ~ 127)
- short: a 16-bit signed two's complement integer. (-32,768 ~ 32,767)
- int: a 32-bit signed two's complement integer. (-2,147,483,648 ~ 2,147,483,647).
- long: a 64-bit signed two's complement integer.
(-9,223,372,036,854,775,808 ~ 9,223,372,036,854,775,807) - float: a single-precision 32-bit IEEE 754 floating point.
- double: a double-precision 64-bit IEEE 754 floating point.
Integer: the set of whole numbers and their opposites.
Floating point and Double point: a method to represent real numbers.
Decimal places: Real or Floating point numbers (e.g. 123.4567 has four decimal places and seven significant digits)
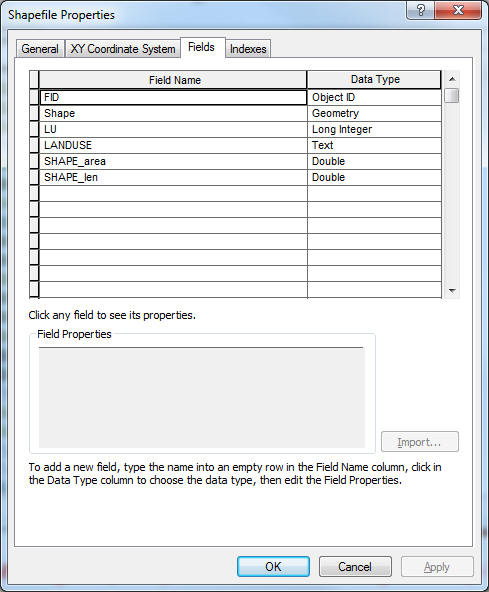
GIS examples
| Data type | Storable range | Size (bytes) | Applications |
| Short integer | -32,768 to 32,767 | 2 | Numeric values without fractional values within specific range; coded values |
| Long integer | -2,147,483,648 to 2,147,483,647 | 4 | Numeric values without fractional values within specific range |
| Single-precision floating-point number (float) | Approximately -3.4E38 to 1.2E38 | 4 | Numeric values with fractional values within specific range |
| Double-precision floating-point number (double) | Approximately -2.2E308 to 1.8E308 | 8 | Numeric values with fractional values within specific range |
http://webhelp.esri.com/arcgisdesktop/9.3/index.cfm?TopicName=Geodatabase_field_data_types
ESRI ARC/INFO.
"In a GIS databases, there is two choices for the storage of data files. You can choose single-precision (32-bit), or double-precision (64-bit) floating-point numbers. Double precision requires twice the storage space, but carries more precision. Typically, double precision preserves about 18 decimal digits, while single precision preserves about 9." (cited fromhttp://srmwww.gov.bc.ca/gis/storageprecision.html)
When you convert a GIS database from a double-precision system to a single-precision system. What happen?
CPU and O.S. design: from 32 Bits to 64 bits. (increase the Traffic Capacity from 4 lanes road to 8 lanes highway).
Analog Map Representation vs.
Digital Map Representation
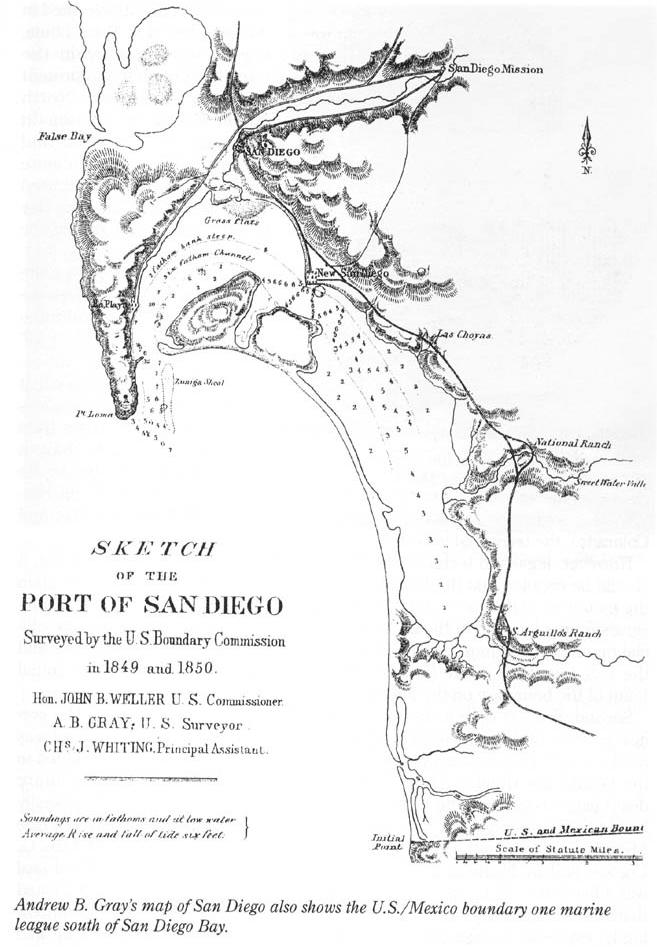
San Diego Maps (1850)
from The Journal of San Diego History Spring/Summer 2000, Volume 46, Number 2-3
The Pantoja Map of 1782 and the Port of San Diego: Some Answers Regarding the International Boundary in the San Diego-Tijuana Region by Jorge A. Vargas
http://www.sandiegohistory.org/journal/2000-2/pantojaphotos.htm
Analog Map Representation (Hand Drawing)
Digital Representation (from a Satellite Imagery)
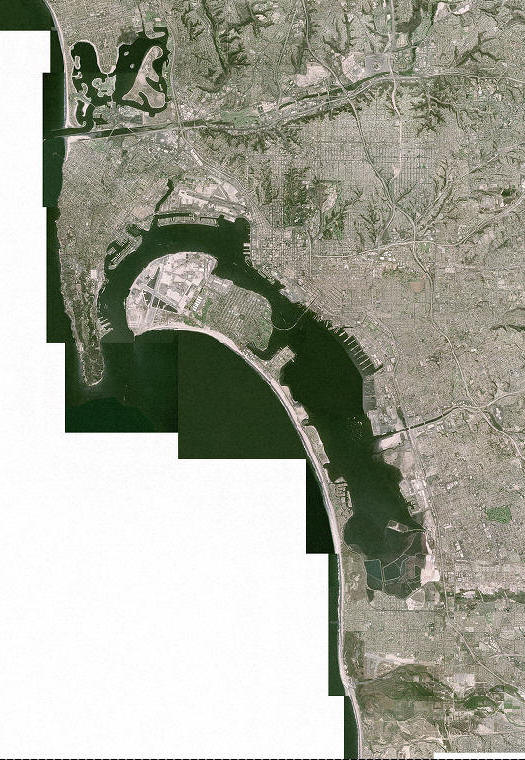
San Diego Historical Map compare to the 2002 Aerial Photos (San Diego).
The advantages of digital map representation (comparing to analog maps):
- Easy to copy and distribute (email, FTP, web pages).
- Easy to modify and analyze map contents. (using GIS software)
The disadvantages:
- Need a computer (or a Pocket PC) -- portability
- Too easy to create by computers by anyone, --- many many BAD designed maps.
The First Law of Geography:
Everything is related to everything else, but near things are more related than distant things. (Waldo Tobler, 1970).
http://en.wikipedia.org/wiki/First_law_of_geography
Examples:
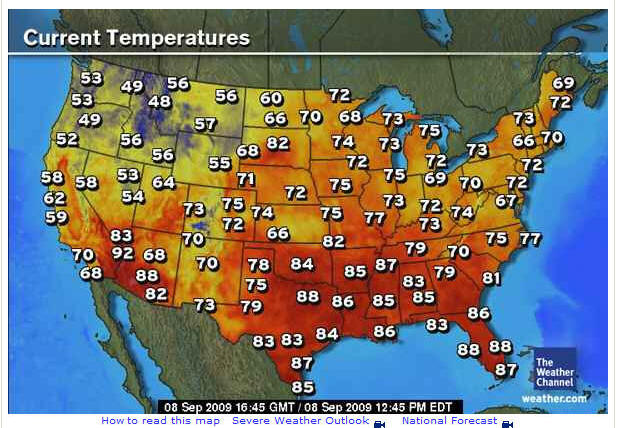
- Weather information ( LOCAL weather forecast is more important for you. )
- Buy or Sale a house .... Local information is more related.. http://www.zillow.com
- Shopping stores: (Local on-sale info is more useful than a discount store in L.A.) .....
What happens when you buy items from online? (Amazon or ebay).? Is the first law of Geography still valid? (invisible: Shipping costs).
GIS examples: Spatial interpolation technique.
E.g. Kriging interpolation methods.
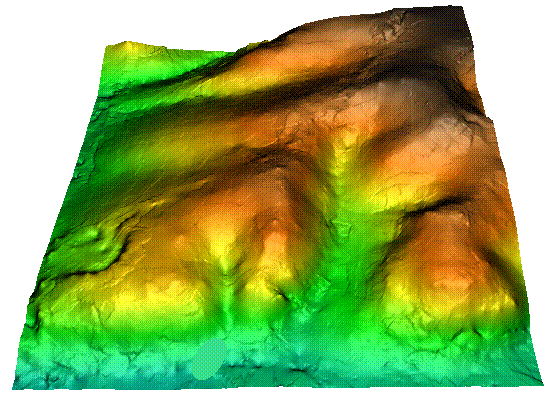
http://skagit.meas.ncsu.edu/~helena/gmslab/interp/F1d.gif
http://skagit.meas.ncsu.edu/~helena/gmslab/ (image source),
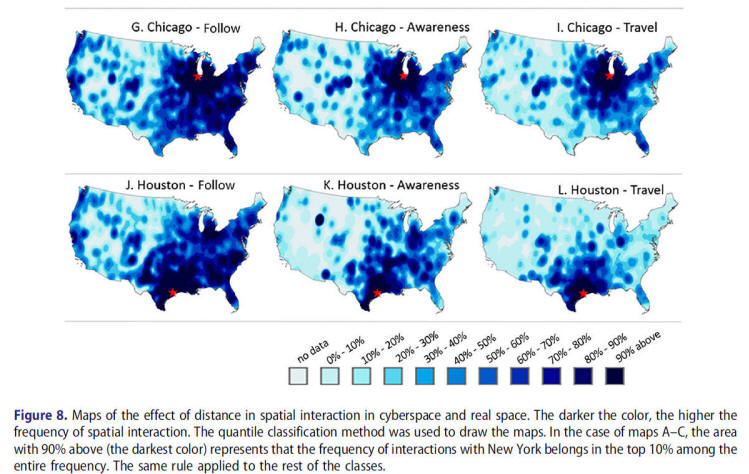
Su Yeon Han, Ming-Hsiang Tsou & Keith C. Clarke (2017): Revisiting
the
death of geography in the era of Big Data: the friction of distance
in cyberspace and real space, International Journal of Digital Earth,
DOI: 10.1080/17538947.2017.1330366
The first law of geography influences on the development of GIS (basis for spatial statistics and spatial analysis).
Geographic data link place, time, and attributes.
The world is infinitely complex, but computer systems are finite.
Geographic information links a place, and often time, with some property of that place (and time).
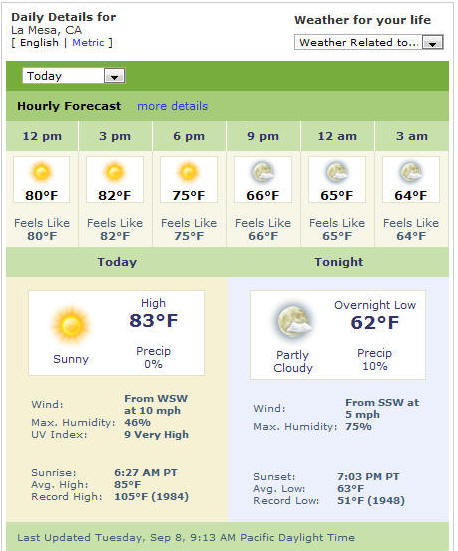
Place: La Mesa
Time: September 8, 2009
Attribute: temperature: 83 degree (F).
source: http://www.weather.com/
Geographic Representation (maps) is connected with the Earth surface or near-surface. (p. 67).
Unit 2.2.
How to represent geographic objects?
Conceptual View:
Discrete Objects and Continuous Fields (section 3.5)
Discrete Objects: represent the geographic world as objects (points, lines, and areas)with well-defined boundaries in otherwise empty space.
- Countable
- Persistent through time (somtimes mobile)
- Have dimensionality
- Biological organisms: Animals and trees
- Human-made objects: vehicles, houses
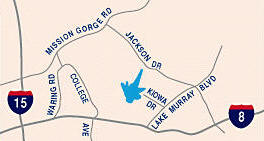
Examples: Lake Murray (polygons), Highway I-8 (lines),
Continuous Fields: represents the real world as a finite number of variables, each one defines at every possible position.
- Properties that vary continuously over space (value is a function of location)
- Property can be of any attribute type including direction
- Elevation as the archetype (A single vlaue at every point on the Earth's surface)
- Soil properties, population density, and temperature...
Examples: Elevations: http://nationalatlas.gov

Raster and Vector
Raster: Implementation of field conceptual model
- Array of cells used to represent object attributes
- Useful as backgroud maps and for spatial analysis
Vector: Implementation of discrete object conceptual model
- Point, line, and polygon representations
- Widely used in cartography and netwrok analysis
Data Format: Rasters and vectors (3.6).
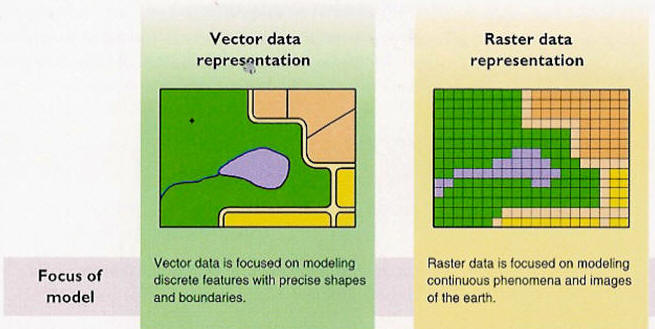
(image source: ESRI published book: Modeling Our World. http://gis.esri.com/esripress/display/index.cfm?fuseaction=display&websiteID=27&moduleID=0
Raster Format
divides the world into arrays of cells and assign attributes (value) to each cell.
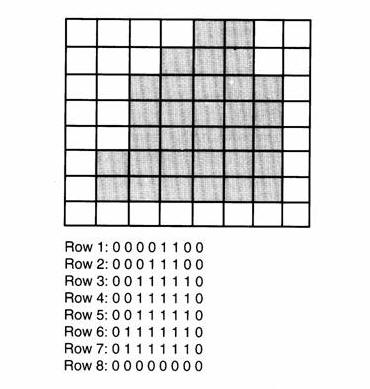
High resolution raster data can contain more details than low resolution data (1m x 1m vs. 30m x 30m).
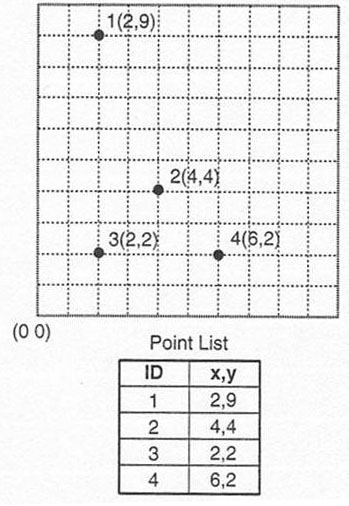
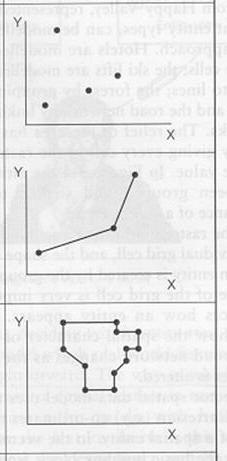
Vector Format
In vector representation, all items can be classified as points, lines, polygons, and 3D volume in a vector-based coordinate system.
All lines are captured as points connected by precisely straight lines.
Map overlay example with RASTER data and VECTOR data.
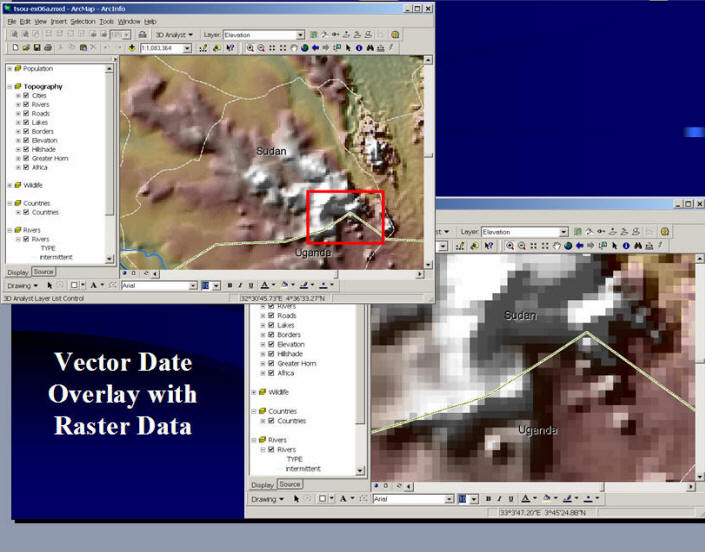
Vector Data example: San Diego Trolley lines. (features -- lines with attributes)
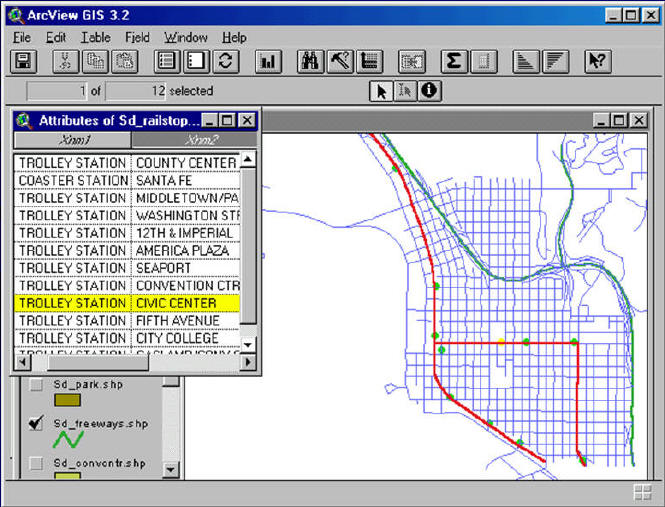
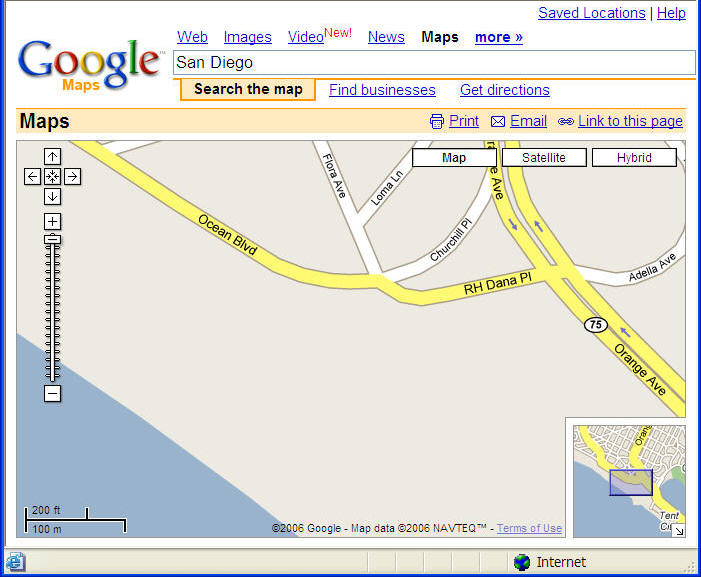
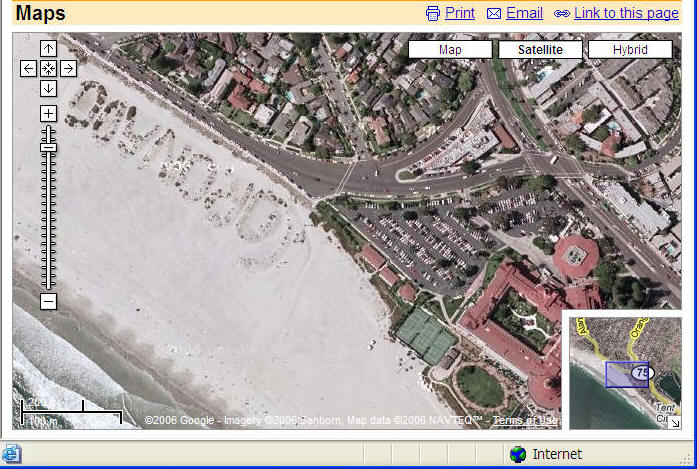
Discuss the vector data and raster data in Google Map. (Map view vs. Satellite View)
The advantages and disadvantages of vector data and raster data?
The limitation of both data formats:
Limitations and extensions of current representations (May Yuan et al. 2004 *).
- Representing volumetric and temporal objects
- Representing heterogeneous data at different scales
- Representing dynamic processes (change, migration, diffusion)
- Representing data uncertainty
* Yuan, M., Mark, D., Egenhofer, M., and Peuquet, D. (2004). Extensions to Geographic Representation: A Research Agenda for Geographic Information Science. Chapter 5 in R. McMaster and L. Usery (eds.), Research Challenges in Geographic Information Science CRC Press, Boca Raton, FL, pp. 129-156, 2004.
Visualization and Animation Maps.
Represent dynamic processes of spatial phenomena.
Many animation examples can be found from the textbook's website: http://www.prenhall.com/slocum/ (Slocum et. al. 2003).
(San Diego Wildfire Animation, Animated GIFs)
Alan MacEachen: three more Visual Variables:
Display date: when the display change starts to initiate.. (U. S. population growth animation) Examples:
http://www.outragegis.com/animations/population-growth.htm
Frequency (temporal texture) is the number of identifiable states per unit time. (similar to rate of changes, but this one highlights the "frequency" rather than "changes". How "smooth" or "fast" does the animation display? Examples: IBM's Deep Thunder project: http://www.research.ibm.com/weather/DT.html
Synchronization is the temporal correspondence of two or more time series. (San Diego wildfire vs. Wind direction)
(MacEachren, A.M. and D. DiBiase. 1991. Animated Maps of Aggregate Data: Conceptual and Practical Problems. Cartography and Geographic Information Systems 18:4, pp. 221-229.)
http://www.nytimes.com/interactive/2009/03/10/us/20090310-immigration-explorer.html
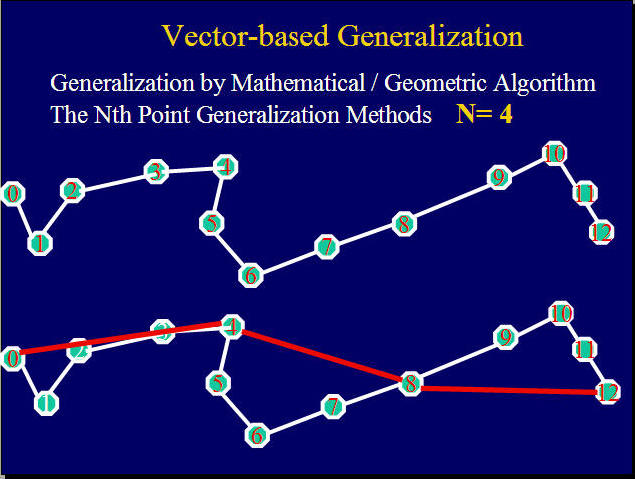
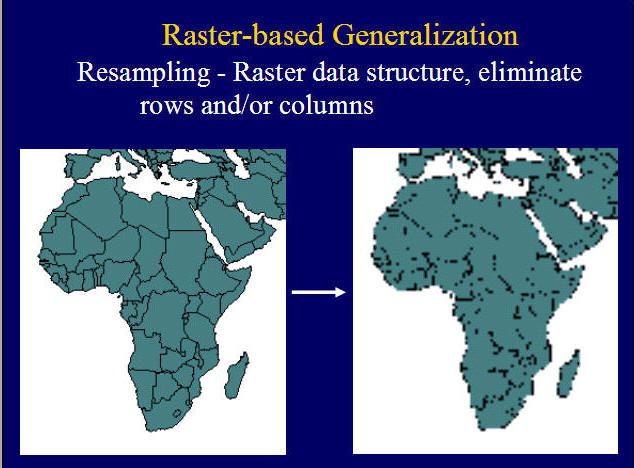
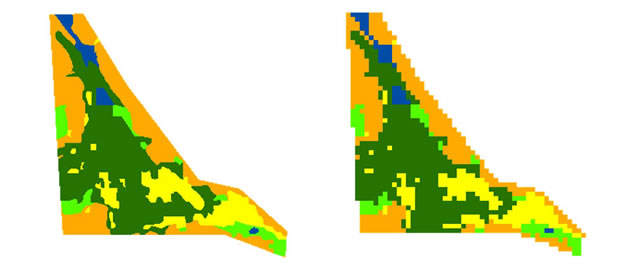
Generalization (text book: 3.8).
The concept of map generalization.
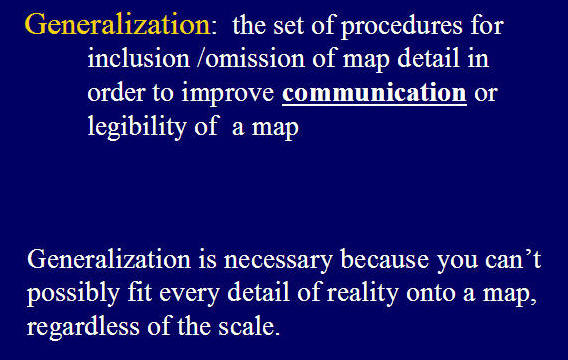
Question: If the high-resolution remote sensing technologies continue to develop, do we still need map generalization?
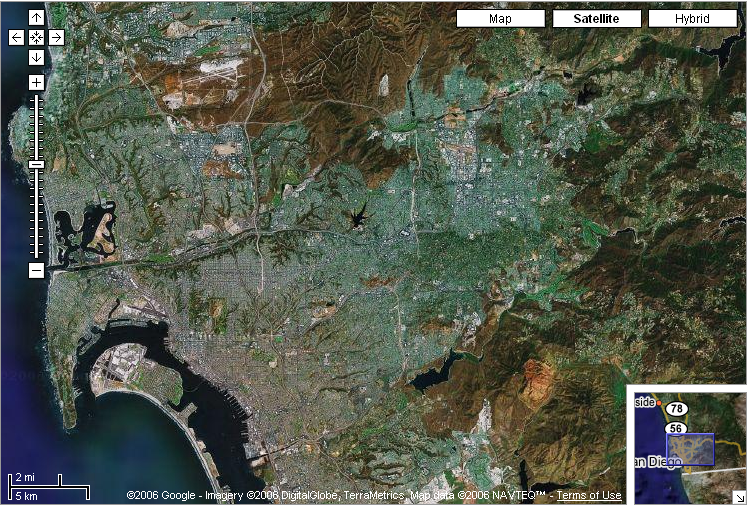
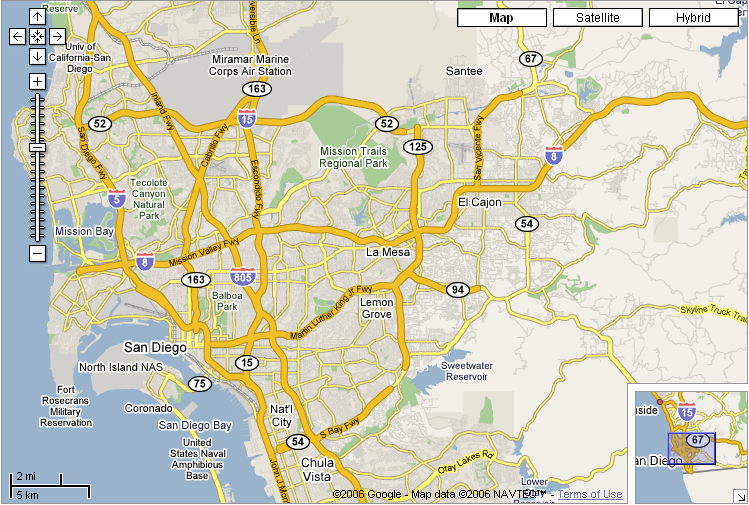
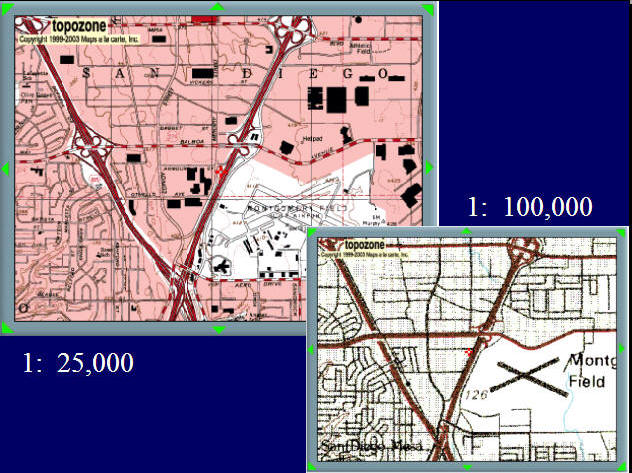
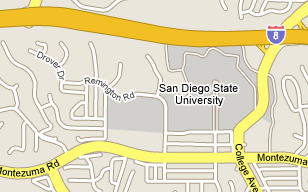
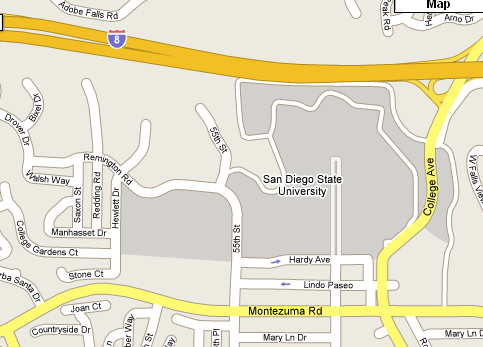
Compare the three Google maps at different scales to point out the examples of
- Simplification
- Smoothing
- Aggregation
Unit 2: In-Class Discussion.
Describe one real world example for Raster Data Format (such as TV screen, digital photos, LCD screen, web pictures, etc.) and one real world example for the Vector Data Format( CAD drawing, True type fonts, Blue-prints, etc.). What is the file size of your data example? (10MB? 40KB? or 3GB?) (If you don't know the exact data size, you can just provide your own estimated file size).
