|
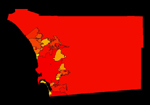
San Diego County 1990 Population
Map
The San Diego County 1990 Population Map displays the population for
San Diego County as well as for all cities in the county from the
lowest to the highest populated city for the year 1990. |
San Diego County 2000 Population
Map
The San Diego County 2000 Population Map displays the population for
San Diego County as well as for all cities in the county from the
lowest to the highest populated city for the year 2000. |
San Diego County Estimated 2020
Population Map
The San Diego County 2020 Population Map displays the population for
San Diego County as well as for all cities in the county from the
lowest to the highest populated city for the year 2020. |
|
San Diego County 1990, 2000 &
2020 Population Comparison Map
The San Diego County 1990, 2000 & 2020 Population
Comparison Map displays on one map the population for San Diego
County as well as for all cities in the county from the lowest to
the highest populated city for the years 1990, 2000 & 2020.
|
San Diego County Percent Change in Population
From 1990 - 2000 Map
The San Diego County Percent Change in Population From 1990 - 2000
Map shows the percent change in population for San Diego County as
well as for all cities in the county from the lowest to the highest
percent change in population from 1990 to 2000. |
San Diego County Percent Change in Population
From 1990 - 2020 Map
The San Diego County Percent Change in Population From 1990 - 2020
Map shows the percent change in population for San Diego County as
well as for all cities in the county from the lowest to the highest
percent change in population from 1990 to 2020. |
|
San Diego County Percent Comparison
Map
The San Diego County Percent Comparison Map displays on one map the
percent change in population for all the cities in San Diego County
from the lowest to the highest percent change in population from 1990
to 2000 and also from 1990 to 2020. |
San Diego County Population Flash
Animation Map
The San Diego County Population Flash
Animation Map uses flash to display the change in population
for San Diego County as well as for all cities in the county from
the lowest to the highest populated city from the year 1990 to 2020.
|
San Diego County Percent Flash
Animation Map
The San Diego County Percent Flash Animation Map uses
flash to display the percent change in population for San Diego
County as well as for all cities in the county from the lowest to
the highest percent change in population from the year 1990 to 2020. |