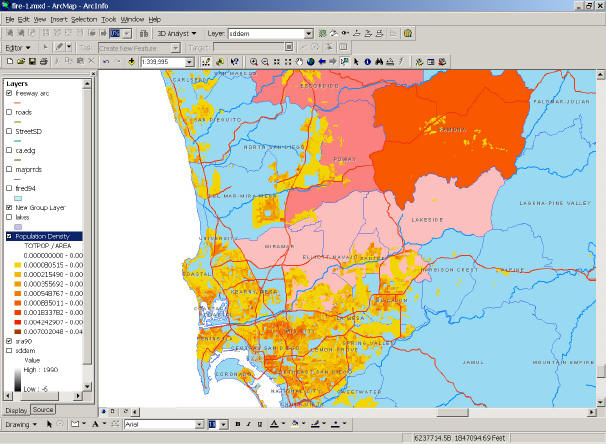
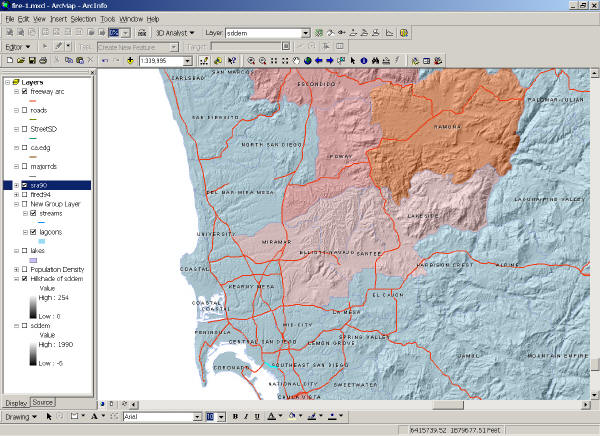
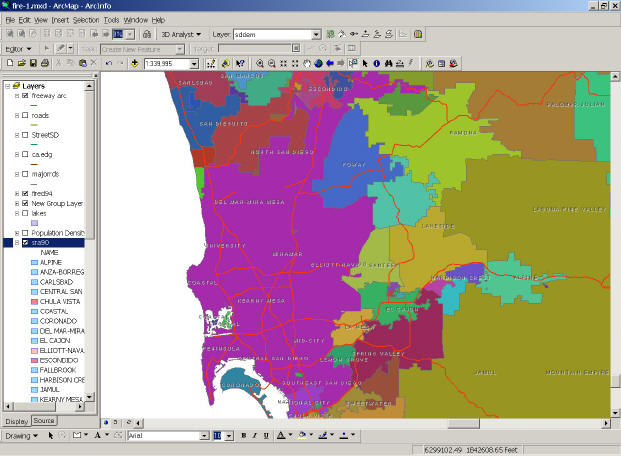
Click on maps for larger versions
![]()
![]()
![]()
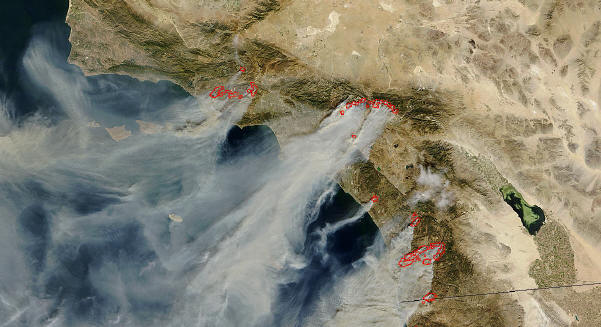
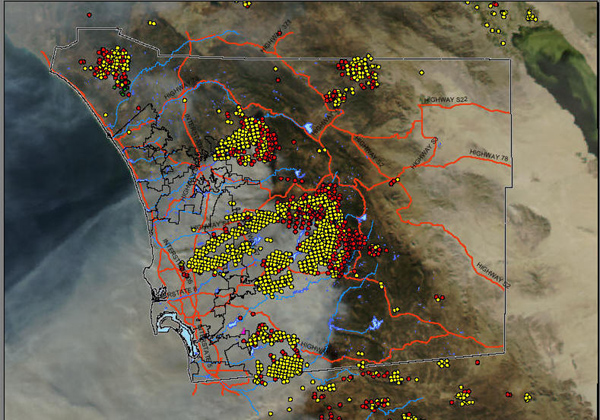
Satellite Image of San Diego Wildfires
10.27.03
Source: http://www.nasa.gov/home/index.html
MODIS thermal mapping data over a satellite
image 10.28.03
This map was created by David F. King (click the map to download the actual
PDF map)
I overlaid MODIS thermal mapping data over a satellite image of the smoke and fire and added some landmarks. The MODIS points are attributed by temperature. I wasn't sure where to make the cutoff, so I used 451 degrees. The red points are probably still burning, and the yellow points are hot, but mostly 150-300 degrees. You can see the outline of what had burned as of about 10 this morning.
David F. King
Senior Biologist
amec Earth & Environmental
5510 Morehouse Drive, San Diego, CA 92121
858-458-9044 x257 858-458-0943 (fax)
