Unit 9
Geospatial Visualization
![]()
Eagle or Letter?

Definition: Visualization is the process of representing information synoptically for the purpose of recognizing, communicating and interpreting pattern and structure (Buttenfield and Mackaness 1991). (synoptically: a general view of a whole )
Its domain encompasses the computational, cognitive and mechanical aspects of generating, organizing, manipulating and comprehending such representations. Representations may be rendered symbolically, graphically, or iconically and are most often differentiated from other forms of expression (textual, verbal, or formulaic) by virtue of their synoptic format and with qualities traditionally described by the term 'Gestalt'.(Buttenfield and Mackaness, 1991, p.432)
Geovisualization = Geospatial Visualization
Geovisualization is the creation and use of visual representations to facilitate thinking, understanding, and knowledge construction about human and physical environments, at geographic scales of measurement. It is a research-led field that integrates approaches from visualization in scientific computing (ViSC), cartography, image analysis, information visualization, exploratory data analysis (EDA), as well as GIS. Its motivation is to develop theories, methods, and tools for visual exploration, analysis, synthesis, and presentation of geospatial data.
- Related to the distribution of phenomena on the surface of the earth
- GVIS: Geographic Visualization
- CVIS: Cartographic Visualization
- Scientific Visualization
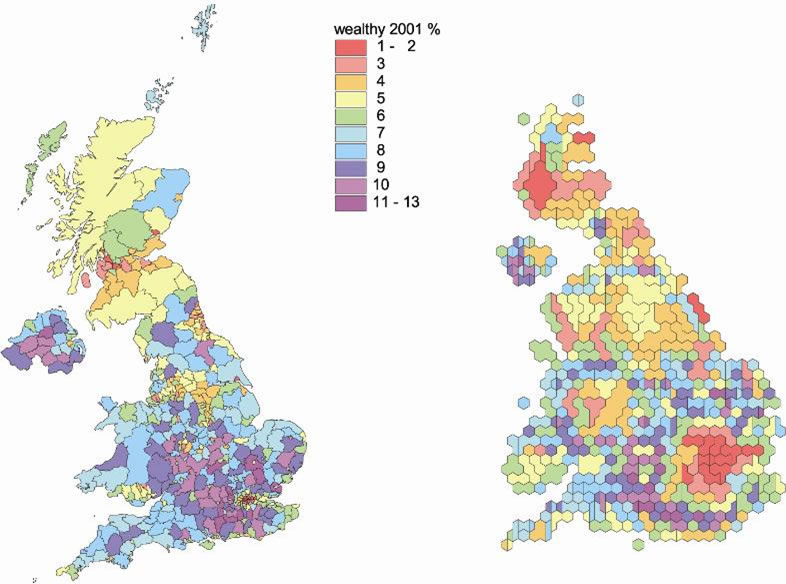
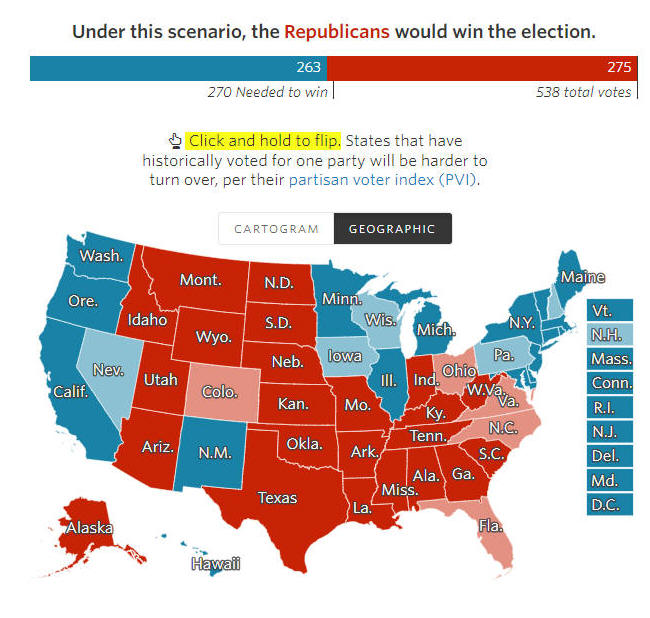
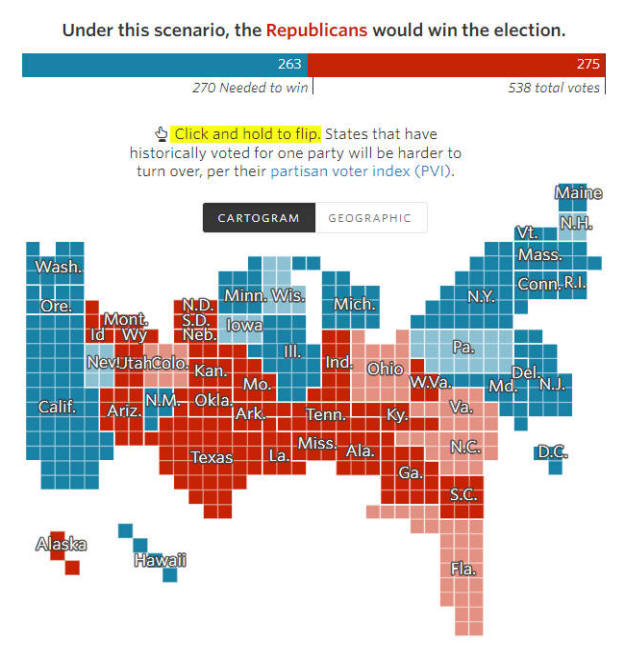
Cartograms:
purposefully distort space based on values of an attribute. (Slocum et al. 2005)
Map transformations that distort area or distance in the interests of some specific objective. (Longley et al. 2011)
Map source:
http://graphics.wsj.com/elections/2016/2016-electoral-college-map-predictions/
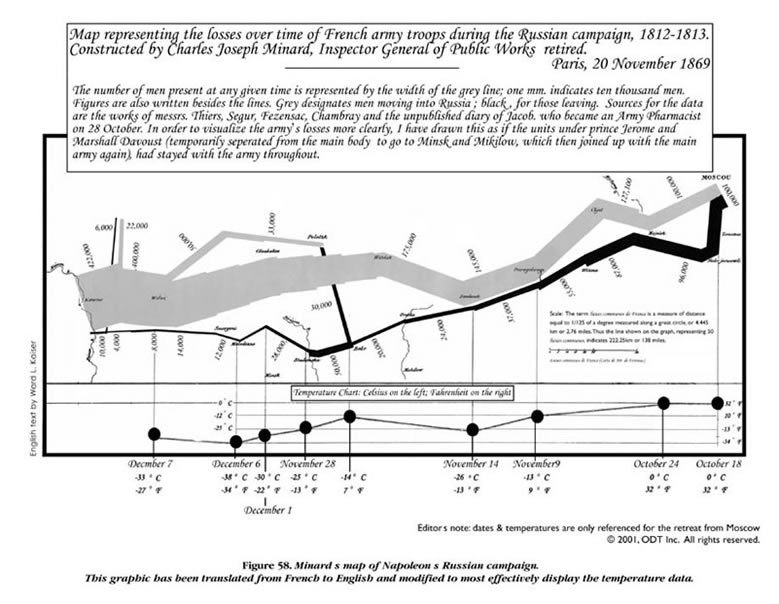
A linear cartogram from 1869: “Moscow March”: http://www.math.yorku.ca/SCS/Gallery/minard/minard-odt.jpg
COLOR MODEL
Color variables:
Value is the quality of lightness or darkness of colors
Hue is the name we give to
the various colors.
(red, blue, yellow).
Saturation (Chroma) is the purity of color.
Value
Hue
Saturation
RGB Model: additive color combination
RED, GREEN, BLUE
http://www.susqu.edu/webcentral/rgbcolor.cfm
(Web site: background color # 00FF00 -->? Green color)
(problem: equal step in the RGB color space do not correspond to equal visual steps.)
(CC) (99) (66) (33)
B B B B
CMYK Model: subtractive colors. (K: Black)
(For printing)
RGB Model CMYK Model
(Image from http://www.sketchpad.net/basics4.htm )
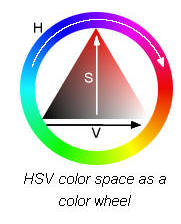
HSV Model:
Same problem with RGB: selecting a color midway between two colors will not result in a color that is perceived to be midway between those colors.
http://en.wikipedia.org/wiki/HSV_color_space
HVC Model:
hue, value and chroma: developed by Tektronix on computer graphic display.
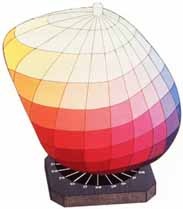
Munsell Model:
Musnsell model is asymmetrical, because the model is perceptually based.
(the lightest possible green does appear brighter than the lightest possible red).
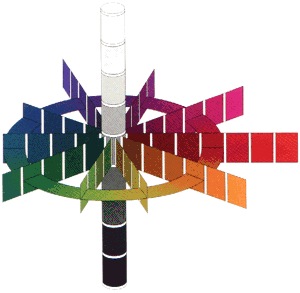
GREEN RED
Color Model History: http://www.cs.brown.edu/courses/cs092/VA10/HTML/ColorModels.html
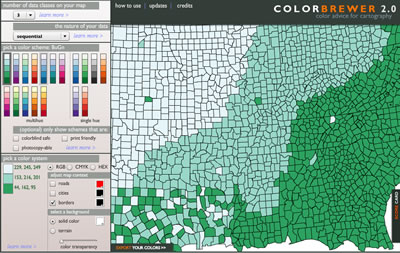
Use colors for spatial information: http://www.personal.psu.edu/faculty/c/a/ cab38/Terrain/AutoCarto.html
Map Display Hardware
https://www.youtube.com/watch?v=3BJU2drrtCM&app=desktop
CRTs (Cathode Ray Tubes)
http://en.wikipedia.org/wiki/Cathode_ray_tube
http://inventors.about.com/library/inventors/blcathoderaytube.htm
Three electron gun: Red, Green, and Blue. Based on RGB color model.
Additive color.
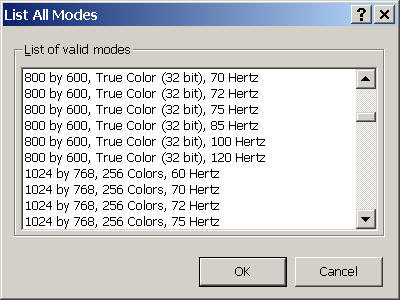
Three phosphors compose a pixel. (Resolution of a monitor)
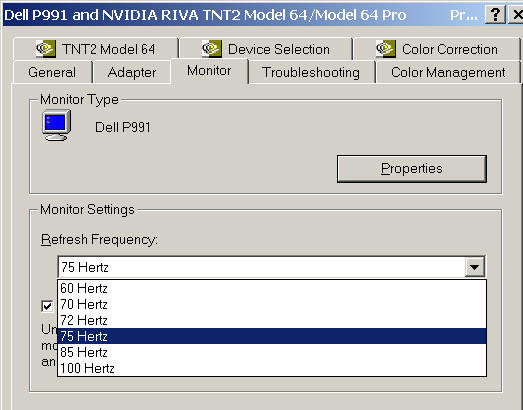
The CRT screen must be refreshed constantly. (Refresh Frequency).
Color on a CRT screen: http://www.chem.purdue.edu/gchelp/cchem/RGBColors/body_rgbcolors.html
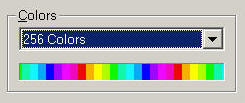
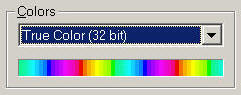
Frame buffer is an area of memory that stores a digital representation of colors:
R + G + B
8 bits (2x2x2x2x2x2x2x2) = 256 (each color gun)
256 (R) x 256 (G) x 256 (B) = 16.8 million colors (TRUE color)
LCDs (Liquid crystal display) http://en.wikipedia.org/wiki/Liquid_crystal_display

- Light,
- Compact,
- low-frequency magnetic fields.
- no flicker (refresh rate)
- One one resultion (fixed pixel)
- Others?
Plasma Display (Pictures from online digitalhome magazine)
- Large screen size
- Broad View angles.
LED (LED-backlit LCD display)
- Instead of the cold cathode flourescent, LED backlighting is used.
- Thinner, lower power, more bright, and better contrast levels.
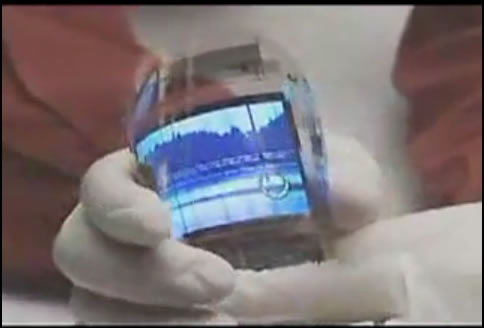
OLED (Organic Light-Emitting Diode)
organic light-emitting diode, a display device that sandwiches carbon-based films between two charged electrodes, one a metallic cathode and one a transparent anode, usually being glass.
http://en.wikipedia.org/wiki/Organic_light-emitting_diode
- Increased brightness
- Faster response time for full motion video
- Lighter weight
- Greater durability
- Broader operating temperature ranges
http://www.youtube.com/watch?v=NcAm3KihFho
Bistable display

(Mobile Display Devices) retain on-screen images even after the power has been turned off.
http://www.pcmag.com/article2/0,1759,1566190,00.asp
http://www.youtube.com/watch?v=jvy755teCG4
DLP, LCOS...
PCMagazine: What's new with Displays
http://www.pcmag.com/article2/0,1759,1566186,00.asp
Geographic/Cartographic Visualization
(GVIS / CVIS) (DiBiase 1990, MacEachren 1994)
From MacEachren's book How Maps work p. 12)
The map is .... not as a communication vehicle, but as one of many potential representations of phenomena in space that a user may draw upon as a source of information or an aid to decision making and behavior in space.
- Visualization: The use of graphics to facilitate thinking, problem solving, and decision making;
- The domains of GVIS: data exploration, visual thinking, revealing unknown spatial patterns.
- focus on "information-processing device (human), human spatial cognition, man-map interaction.
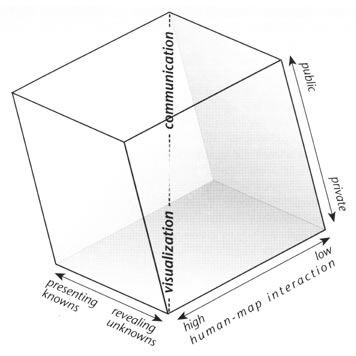
Which corner is geovisualization? Which corner is cartographic visualization?
MacEachren's 3D cube:
Source: https://www.e-education.psu.edu/geog486/book/export/html/1407, Alan MacEachren, "Visualization in Modern Cartography: Setting the Agenda," in A.M MacEachren and D. R. F. Taylor (eds.). Visualization in Modern Cartography. Oxford, England: Elsevier, 1994. p. 6.)
- Private vs. Public
- Presenting knowns vs. Revealing unknowns
- High interaction vs. low interaction
Animation (one of the visualization methods)
Requires additional visual variables beyond those used for static maps: duration, rate of change, and order."
- Duration (d): frame display time. The length of time that each frame of an animation is displayed.
- Short duration --> smooth animation
- Long duration --> choppy animation. - Rate of Change (m/d): the magnitude of change (m) divided by the duration of each frame (d).
- change the locations of the points
- change the sizes of the points
- Order: the sequence in which frames are presented. (Backward play)
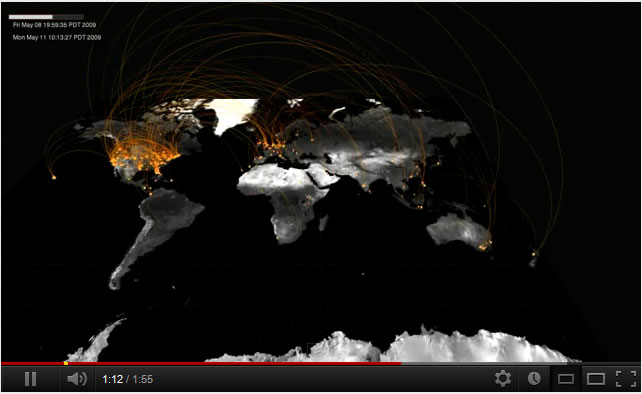
Example: NASA California Wildfire animation.
http://svs.gsfc.nasa.gov/vis/a000000/a002800/a002858/index.html
(San Diego Wildfire Animation, Animated GIFs)
Early development back to 1930s with camera and hand-drawing maps. --> computer-based animation: Waldo Tobler's 3D portrayal of a population growth model for the city of Detroit. (1970). (stored in Video Tape now).
1991, David DiBiase and Alan MacEachren -- define visual variables for animation and categorize various types of animation. (MacEachren, A.M. and D. DiBiase. 1991. Animated Maps of Aggregate Data: Conceptual and Practical Problems. Cartography and Geographic Information Systems 18:4, pp. 221-229.)
Types of Animations:
Emphasize change: change in position vs. change in an attribute.
Time series emphasize change through time. Examples: AIDS Mortality in the United States http://www.ciesin.org/datasets/cdc-nci/regions.html
Re-expression provides an alternative graphic representation (like change the classification methods in Population density).
Dr. Michael Peterson's animation (Change of classes and change of classification methods)
http://maps.unomaha.edu/books/IACart/book.html#ANI
Emphasize location (warning signals)
Dr. Michael Peterson's animation (Change of attributes)
http://maps.unomaha.edu/books/IACart/book.html#ANI
Early Example of Cartographic Animations (during World War II, Disney Studio):
http://maps.unomaha.edu/AnimArt/ActiveLegend/Peterson.html (created by Prof. Michael P. Peterson, Department of Geography / Geology, University of Nebraska at Omaha )
Another good example: Battle of China (1944)
http://www.youtube.com/watch?v=krOFpw5O7Pc&feature=response_watch
Maps in 2D vs. 3D. vs. 4D
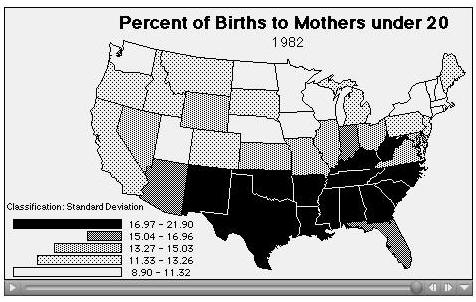
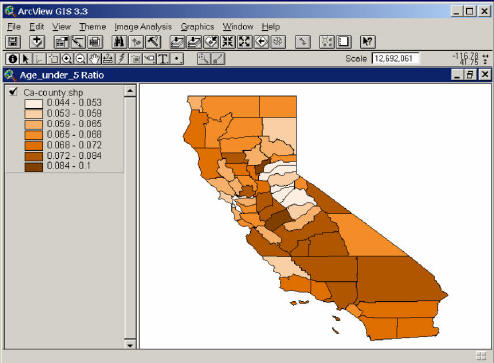
2D Mapping
Choropleth Mapping
The need for data standardization (normalization), in which raw totals are adjusted for differing sizes of enumeration units. (Administration units, like state or county boundary)
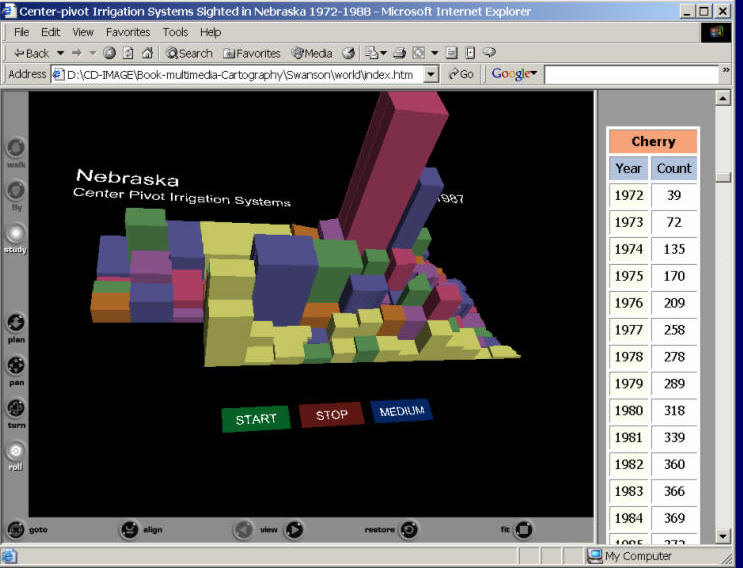
2.5 D Symbols (2.5 dimensional, Volume):
- 2 1/2 -D: a surface in which geographic location is defined by x and y coordinate pairs and the value of the phenomenon is the height above a zero point.
- lack of true Z coordinate (replaced by the attribute values)
2.5 D San Diego Temperature Map
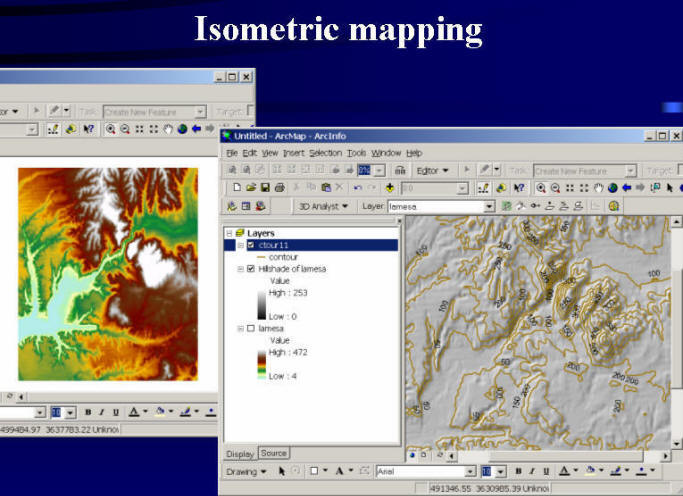
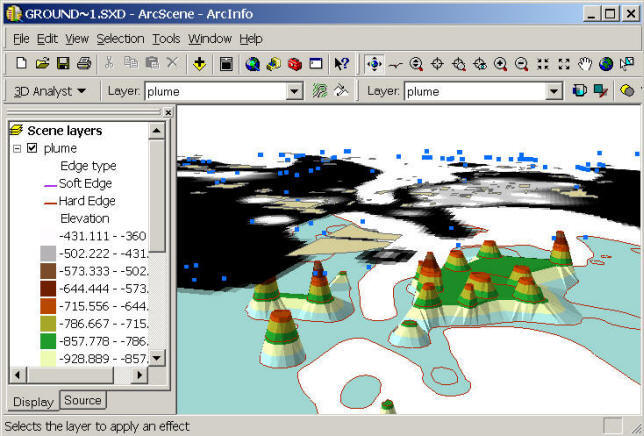
3D symbols and objects (Three-dimensional):
- Any point on the surface is specified by four variables (X, Y, Z, and the values).
- 3D maps (usually mixed up with 2 1/2 maps)
- Underground water quality
- CO2 level in the atmosphere.
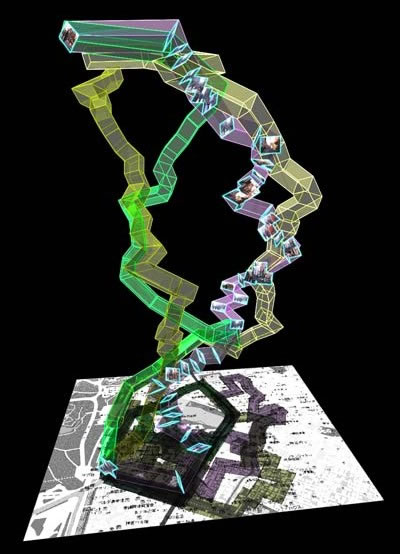
Activity–travel maps, source: http://www.acoates.co.uk/category/dissertation/
4D (Adding the Temporal Dimension)
Animation (San Diego Wildfire animation) http://map.sdsu.edu
Fire Spread Animation Movies (created by Harry D. Johnson, Department of Geography, SDSU). Quicktime Movies (Require 6.5 or later version. Click here to download the Quicktime 6.5.1 player.http://www.apple.com/quicktime/download/standalone/ )
(Cedar Fire Animation) (San Diego County)
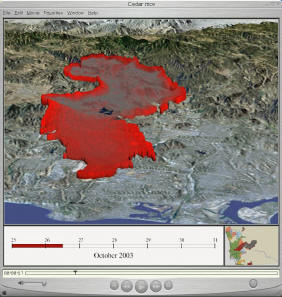
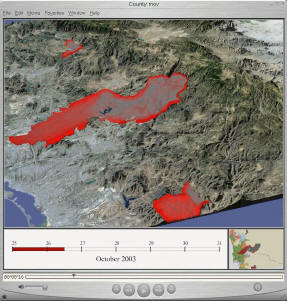
http://www.youtube.com/watch?v=rUuPBfEkiJs
Unit 9: In-Class Discussion
Please select one Web mapping example for the purpose of geographic visualization and give a short introduction. What type of maps (2D or 3D or 4D) is it? What are their color scheme? What kinds of knowledge are provided by this visualization example.
