Unit 6.1
GIS Data Collection and Database Management
GIS Data Collection is one of the most expensive GIS tasks! (In a traditional GIS project, the cost of GIS data collection can be 80% of the total project budget.)
First-Hand (Primary) GIS sources:
Remote sensing images, GPS, survey data;
(Primary data sources are those collected directly in digital format specifically for GIS use.)
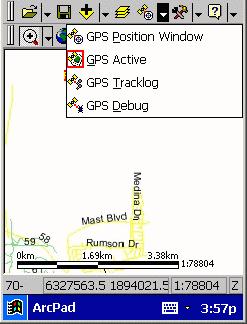
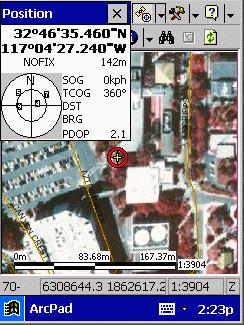
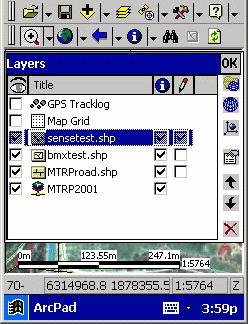
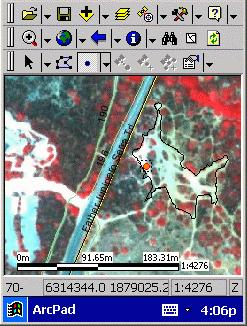
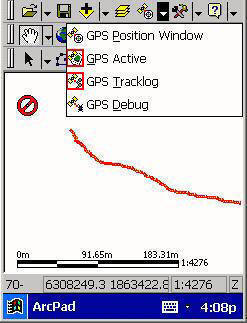
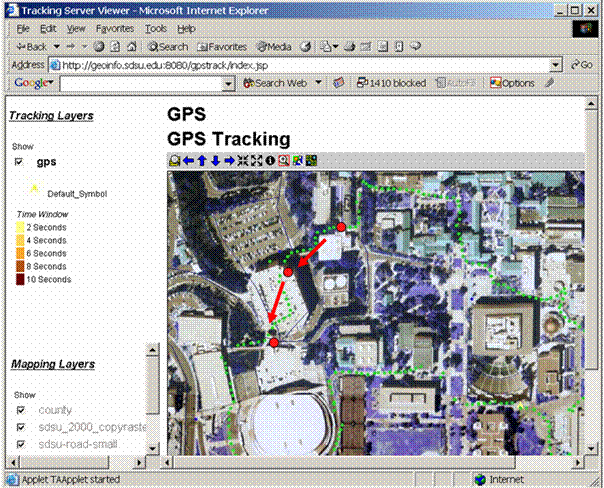
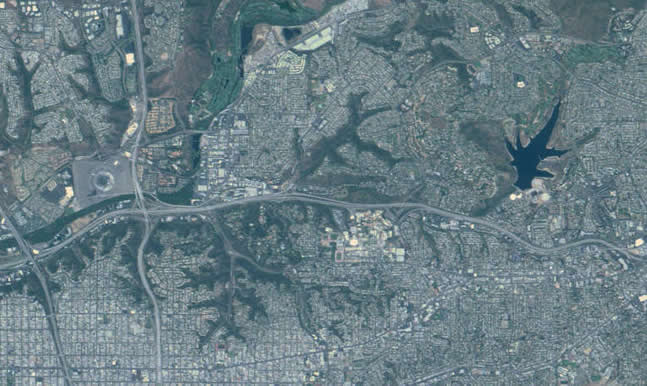
Example1 : GPS tracking function in field survey. (vector-examples):
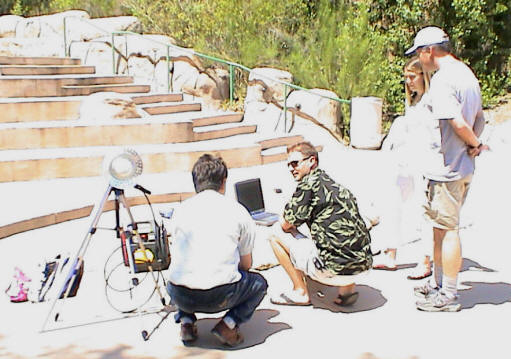
http://map.sdsu.edu/mobilegis/photo_mtrp.htm
|
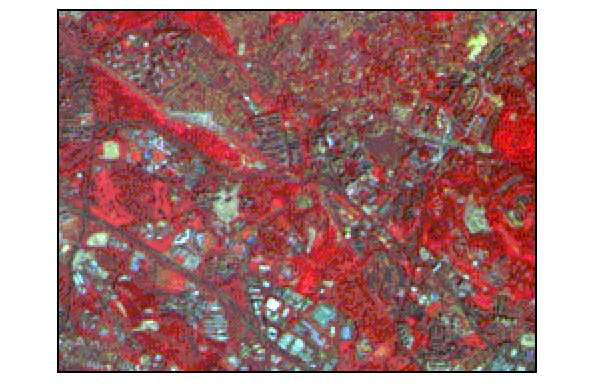
Example 2: Satellite Imagery: FORMOSAT-II (San Diego Region).
http://www.spotimage.fr/html/_167_171_977_.php
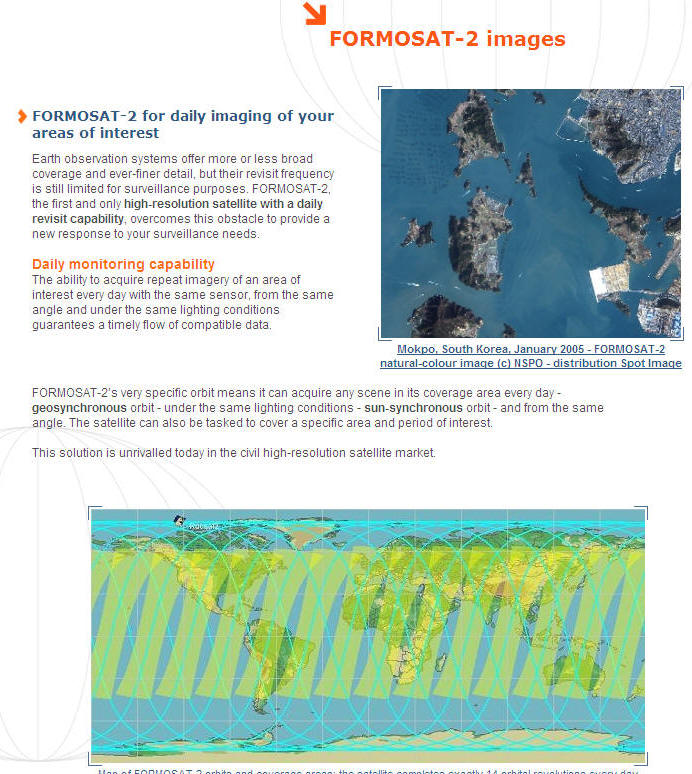
Images from http://www.spotimage.fr/html/_167_171_977_.php
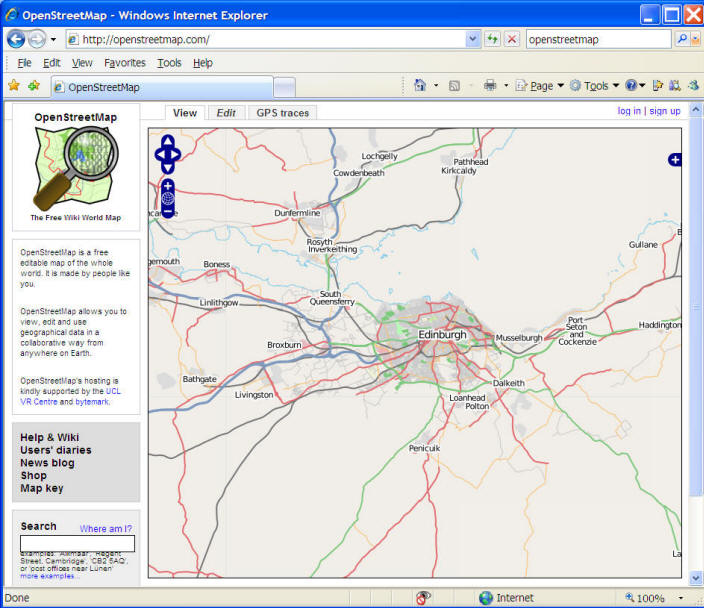
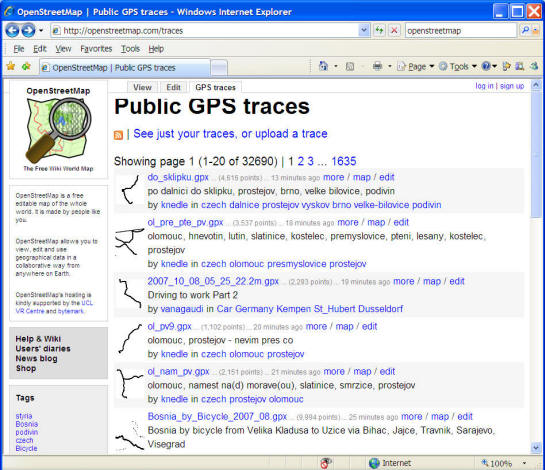
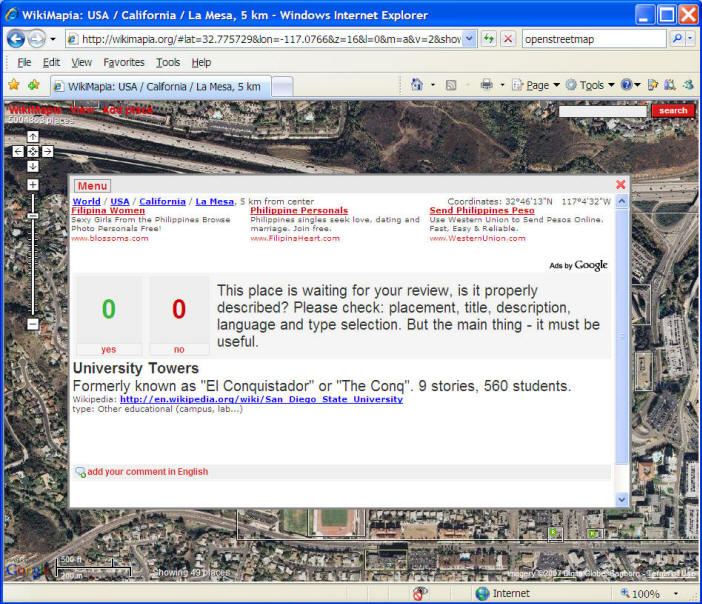
Web-based Collaborative Data INPUT (Participatory GIS, Crowd Sourcing).
1. OpenStreetMap http://openstreetmap.com/
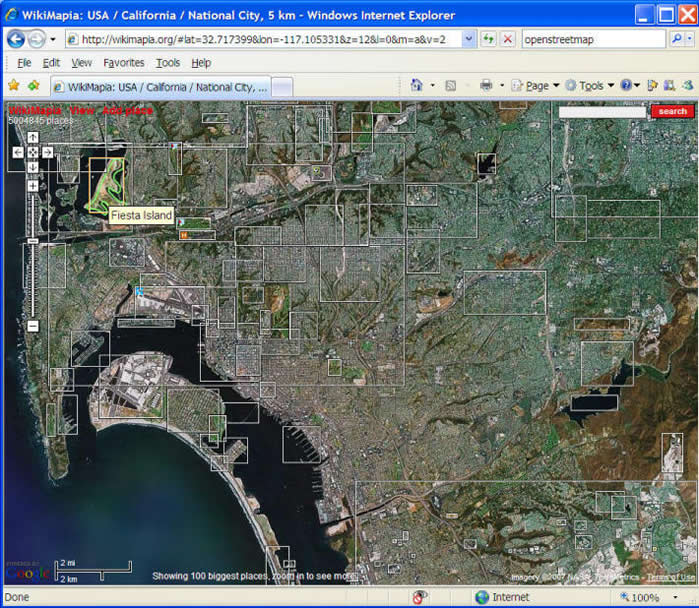
2. Wikimapia.org http://wikimapia.org
Second-Hand (Secondary) GIS sources:
Re-scanned images, digitizing maps, digital elevation model.
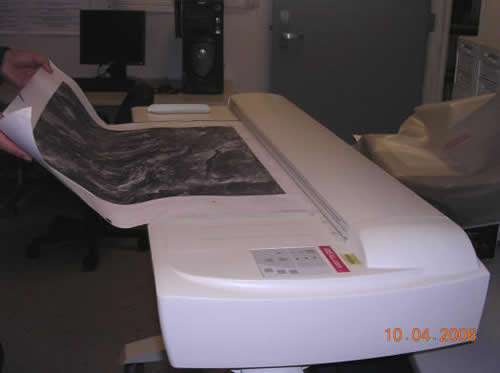
Secondary GIS data sources are digital and analog datasets that were originally captured in another format (such as papers or films). We will need to convert (by scanning or digitizing) the original format of data into digital GIS data formats.
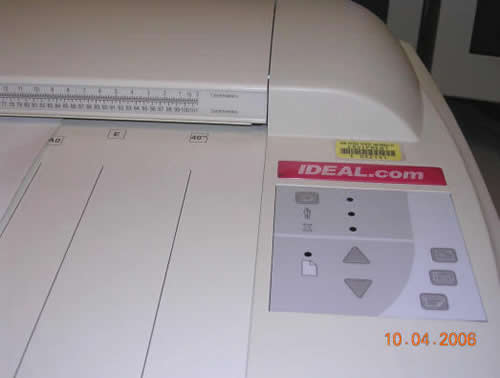
Re-scanning maps or images (a large-size scanner at the CESAR lab)
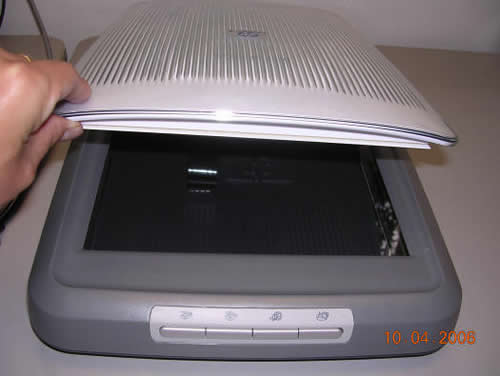
Smaller scanner.
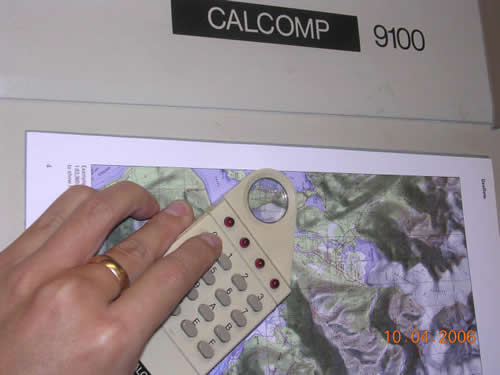
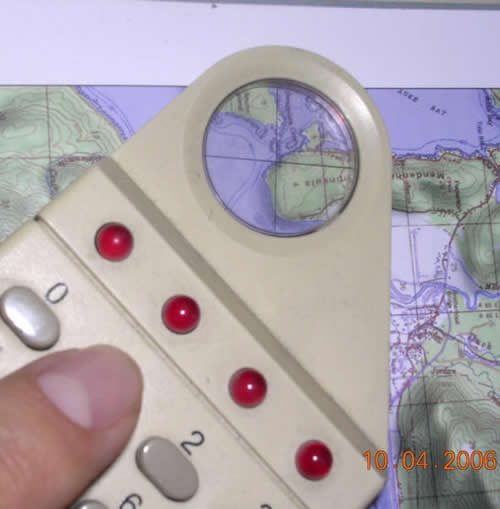
Digitizer.
Third-Hand GIS sources(?) :
Data sharing by Spatial Web.
CD-ROM, On-line downloadable datasets.
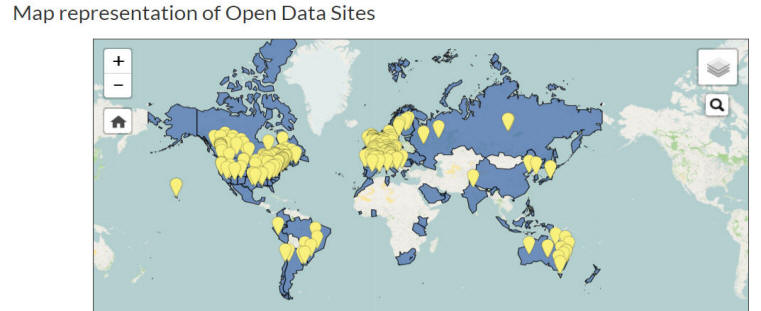
Open Data and Open Government:
http://opendatahandbook.org/guide/en/what-is-open-data/
What is Open?This handbook is about open data - but what exactly is open data? For our purposes, open data is as defined by the Open Definition:Open data is data that can be freely used, re-used and redistributed by anyone - subject only, at most, to the requirement to attribute and sharealike.The full Open Definition gives precise details as to what this means. To summarize the most important:
-
Availability and Access: the data must be available as a whole and at no more than a reasonable reproduction cost, preferably by downloading over the internet. The data must also be available in a convenient and modifiable form.
-
Re-use and Redistribution: the data must be provided under terms that permit re-use and redistribution including the intermixing with other datasets.
-
Universal Participation: everyone must be able to use, re-use and redistribute - there should be no discrimination against fields of endeavour or against persons or groups. For example, ‘non-commercial’ restrictions that would prevent ‘commercial’ use, or restrictions of use for certain purposes (e.g. only in education), are not allowed.
If you’re wondering why it is so important to be clear about what open means and why this definition is used, there’s a simple answer: interoperability.
(cited from http://opendatahandbook.org/guide/en/what-is-open-data/_ )
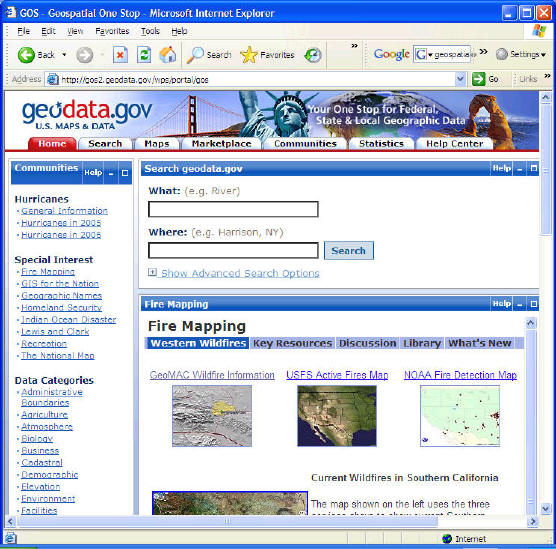
Data.GOV https://www.data.gov/open-gov/
Data.gov is the U.S. federal government’s open data site, and aims to make government more open and accountable. Opening government data increases citizen participation in government, creates opportunities for economic development, and informs decision making in both the private and public sectors.Data.gov implements the Executive Order on making government data open and machine readable as well as the federal Open Data Policy.
Open Data in the United
StatesNumerous states, cities and counties have launched open
data sites.
Data Uncertainty
What is Data Uncertainty?
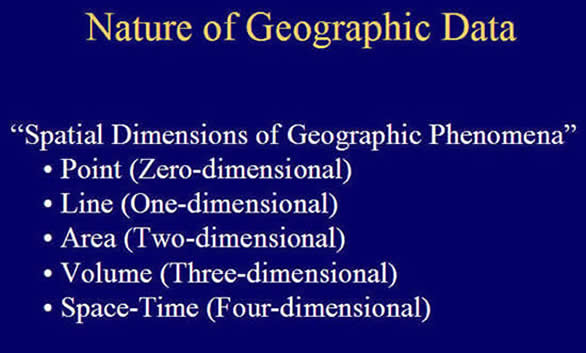
Uncertainty is an umbrella term to describe the problems that arise out of incomplete representations of the world.
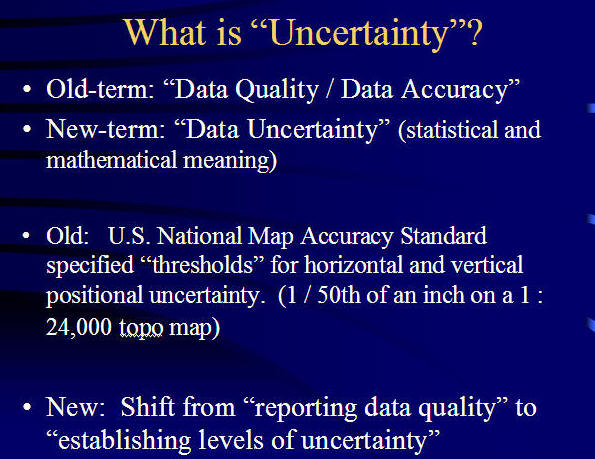
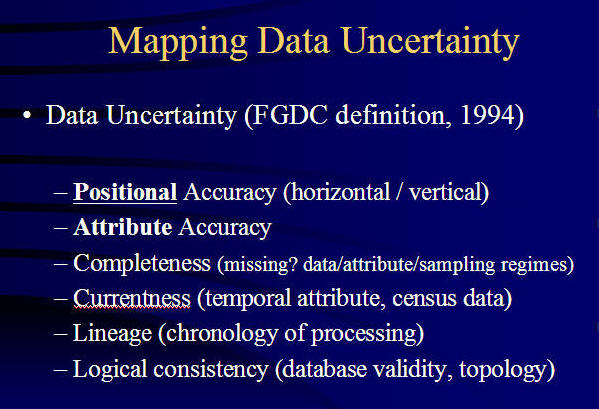
Measurement and representation uncertainty
“Mixed” problem (What kinds of data formats? In these pictures?)
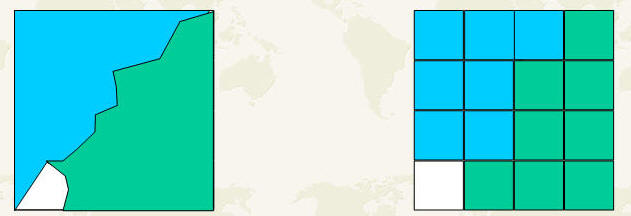
How to represent [Uncertainty]? Probability vs. Fuzzy logic.
Probability: (from statistics explanation)
Gambling (Throw a Dice --- How likely to get #6 ?)
Weather (Raining or not?)
On-line Tools: http://www.shodor.org/interactivate/activities/ExpProbability/?
version=1.4.2_06&browser=MSIE&vendor=Sun_Microsystems_Inc.
Fuzzy logic; (for a non-clearly defined situation)
( The Laundry Washer's temperature setting).
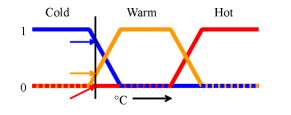
nFuzzy logic (http://en.wikipedia.org/wiki/Fuzzy_logic)
Data Uncertainty Paper: http://www.wiu.edu/users/cre111/older/CGFinal/paper.htm
Visualizing Spatial Data Uncertainty Using Animation
(images from http://www.wiu.edu/users/cre111/older/CGFinal/paper.htm ).
by Charles R. Ehlschlaeger, Dept. of Geography, Hunter College, NY 10021, USA, Ashton M. Shortridge, NCGIA, University of California, Santa Barbara, CA 93106, USA, Michael F. Goodchild, NCGIA, University of California, Santa Barbara, CA 93106, USA.
Data Sampling:
(descriptions are from Wikipeida: http://en.wikipedia.org/wiki/Sampling_%28statistics%29 )
Sampling is that part of statistical practice concerned with the selection of individual observations intended to yield some knowledge about a population of concern, especially for the purposes of statistical inference. In particular, results from probability theory and statistical theory are employed to guide practice.
(from Wikipeida: http://en.wikipedia.org/wiki/Sampling_%28statistics%29 )
The sampling process consists of five stages:
- Definition of population of concern
- Specification of a sampling frame, a set of items or events that it is possible to measure
- Specification of sampling method for selecting items or events from the frame
- Sampling and data collecting
- Review of sampling process
Why sampling?
(Save money? faster results? Prediction? Accurate? )
Examples: Election sampling results: Candidate A 35% vs. Candidate B. 20% (1000 adults telephone interviews).
Population concerns: Congress Mid-term Election .
sampling frame: Who will you support? A vs. B.
Sampling methods: telephone interviews or on-line survey.
Simple Random sampling:
Definition (Burt and Barber 1996): From an infinite population, a simple random sample is selected in such a way that all observations chosen are statistically independent.
Each subject from the population is chosen randomly and entirely by chance, such that each subject has the same probability of being chosen at any stage during the sampling process. This process and technique is known as Simple Random Sampling: http://en.wikipedia.org/wiki/Random_number_table
 a random number table.
(In reality, it is very difficult to create a purely "random sample" method).
Systematic sampling:
Definition (Burt and Barber 1996): To draw a systematic random sample, every n th element of the sampling frame is chosen, beginning with a randomly chosen point
the selection of every nth element from a sampling frame, where n, the sampling interval, is calculated as:
n = Number in population / Number in sample
Using this procedure each element in the population has a known and equal probability of selection. This makes systematic sampling functionally similar to simple random sampling. It is however, much more efficient and much less expensive to do.
(descriptions are from Wikipeida: http://en.wikipedia.org/wiki/Sampling_%28statistics%29 )
Example: Digital Elevation Model (DEM). (30M x 30M)
Stratified sampling:
Definition (Burt and Barber 1996): A stratified random sample is obtained by forming classes, or strata, in the population and then selects a simple random sample from each.
When sub-populations vary considerably, it is advantageous to sample each subpopulation (stratum) independently. Stratification is the process of grouping members of the population into relatively homogeneous subgroups before sampling. The strata should be mutually exclusive : every element in the population must be assigned to only one stratum. The strata should also be collectively exhaustive : no population element can be excluded. Then random or systematic sampling is applied within each stratum. This often improves the representativeness of the sample by reducing sampling error. It can produce a weighted mean that has less variability than the arithmetic mean of a simple random sample of the population.
There are several possible strategies:
- Proportionate allocation: uses a sampling fraction in each of the strata that is proportional to that of the total population. If the population consist of 60% in the male stratum and 40% in the female stratum, then the relative size of the two samples (one males, one females) should reflect this proportion.
- Optimum allocation (or Disproportionate allocation): Each stratum is proportionate to the standard deviation of the distribution of the variable. Larger samples are taken in the strata with the greatest variability to generate the least possible sampling variance.
A real-world example of using stratified sampling would be for a US political survey. If we wanted the respondents to reflect the diversity of the population of the United States, the researcher would specifically seek to include participants of various minority groups such as race or religion, based on their proportionality to the total population as mentioned above (the first stage). A stratified survey could thus claim to be more representative of the US population than a survey of simple random sampling orsystematic sampling (the second stage).
(descriptions are from Wikipeida: http://en.wikipedia.org/wiki/Sampling_%28statistics%29 )
Cluster sampling:
Definition (Burt and Barber 1996): The population is divided into mutually exclusive and exhaustive clases, as in the initial step in stratified sampling. Certain clusters are selected for detailed study, usually by some random procedure. Cluster sampling is completed either by taking a complete census of those clusters selected for sampling or by selecting a random sample from these clusters. Ideally, each cluster should be internally heterogeneous.
A sampling technique used when "natural" groupings are evident in the population. The total population is divided into these groups (or clusters), and a sample of the groups is selected. Then the required information is collected from the elements within each selected group. This may be done for every element in these groups, or a sub sample of elements may be selected within each of these groups.
Each cluster should be a small scale version of the total population. The clusters should be mutually exclusive and collectively exhaustive. A random sampling technique is then used on any relevant clusters to choose which clusters to include in the study. In single-stage cluster sampling, all the elements from each of the selected clusters are used. In two-stage cluster sampling, a random sampling technique is applied to the elements from each of the selected clusters.
One version of cluster sampling is area sampling or geographical cluster sampling. Clusters consist of geographical areas. A geographically dispersed population can be expensive to survey. Greater economy than simple random sampling can be achieved by treating several respondents within a local area as a cluster. It is usually necessary to increase the total sample size to achieve equivalent precision in the estimators, but the savings in cost may make that feasible.
(descriptions are from Wikipeida: http://en.wikipedia.org/wiki/Sampling_%28statistics%29 )
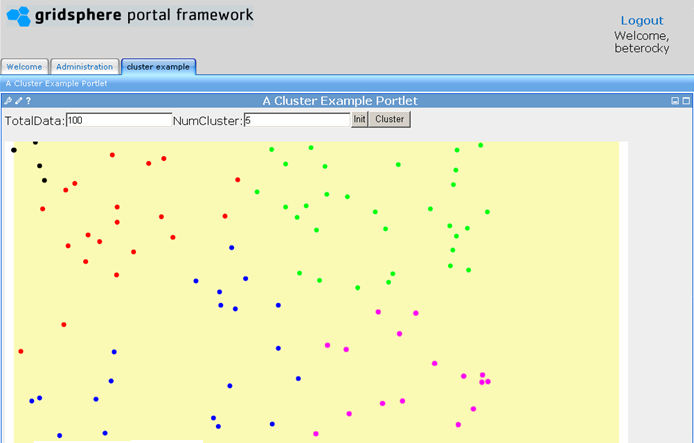
Example: Sampling and data collecting
CNN website example:
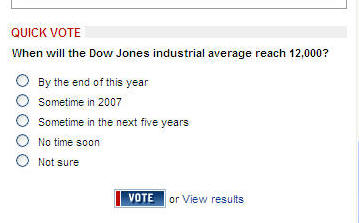
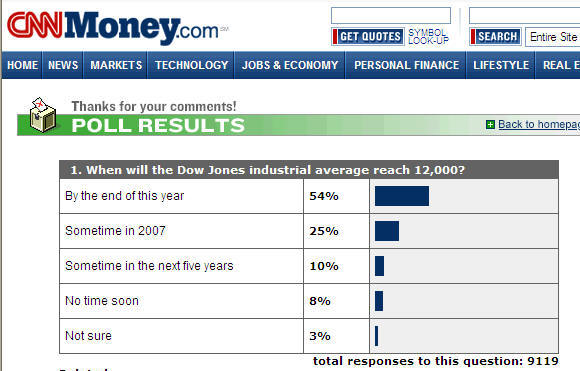
Discussion:
Does the CNN on-line survey is a good sampling method?
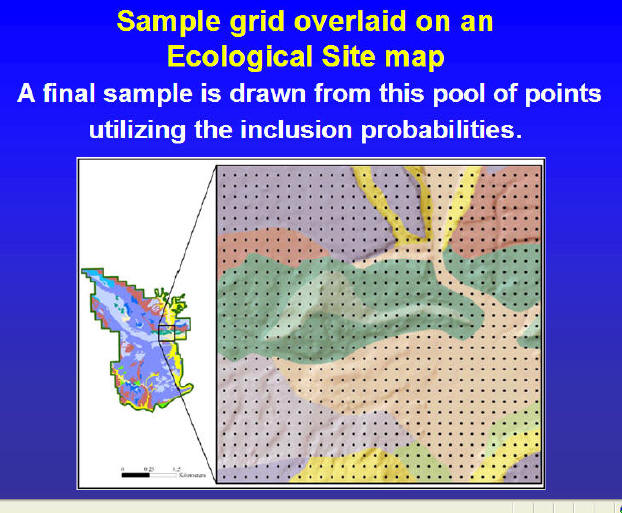
Spatial data sampling.
Simple Random Sampling:
Systematic Sampling:
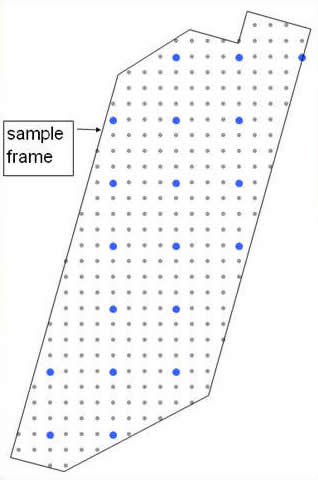
(Image sources: http://science.nature.nps.gov/im/monitor/meetings/Austin_05/LMorrison_SamplingDesign.ppt)
Stratified sampling:
(Strata: River and Sub-streams)
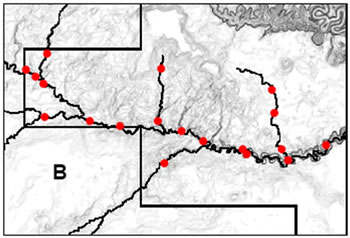
(Image source: http://science.nature.nps.gov/im/monitor/meetings/Austin_05/LMorrison_SamplingDesign.ppt)
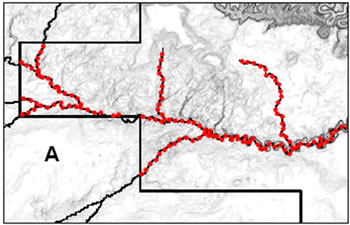
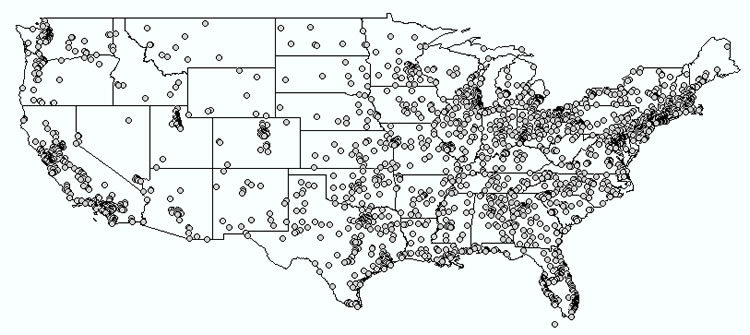
Cluster sampling:
(U.S. Cities: select several cities as clusters)
Two Stage Systematic Sampling Design:
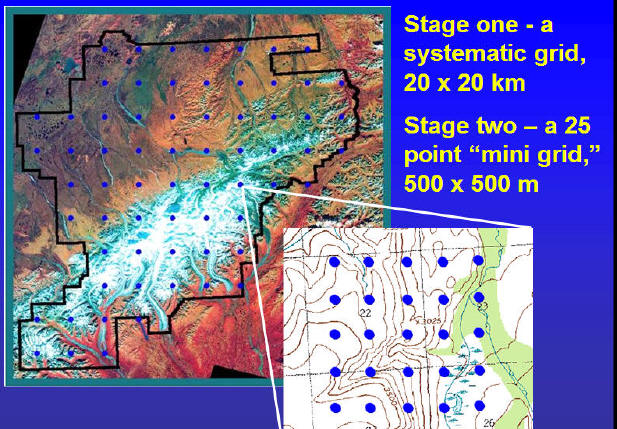
(Image source: http://science.nature.nps.gov/im/monitor/meetings/Austin_05/LMorrison_SamplingDesign.ppt)
Temporal sampling design.
(when and how often to do the sampling?)
(Each Year? Each month? Each weeks? Summer or Winter? -- Seasonal changes).
Data collection workflow:
- Planning,
- Preparation,
- Digitizing/Transfer,
- Editing/Improvement, and
- Evaluation
Two data collection methods:
- data capture
- data sharing and transfer
Data Capture
- Remote Sensing Data (Resolution)
- Vector Data (GPS & Surveying)
Remote Sensing Data.
Four resolution aspects of remote sensing data
- spatial
- spectral
- radiometric
- temporal
Spatial resolution:
Low resolution example (MODIS 1km)
Part of a MODIS scene acquired by CRISP on 3 March 2001. The image is shown here at a resolution of about 1 km. At this resolution only very coarse features of the land cover and ocean surface can be seen.
(http://www.crisp.nus.edu.sg/~research/tutorial/modis1.htm)
High resolution (SPOT 20m)
(http://www.crisp.nus.edu.sg/~research/tutorial/image.htm)
Very high resolution (IKONOS 1m)
(http://www.crisp.nus.edu.sg/~research/tutorial/image.htm)
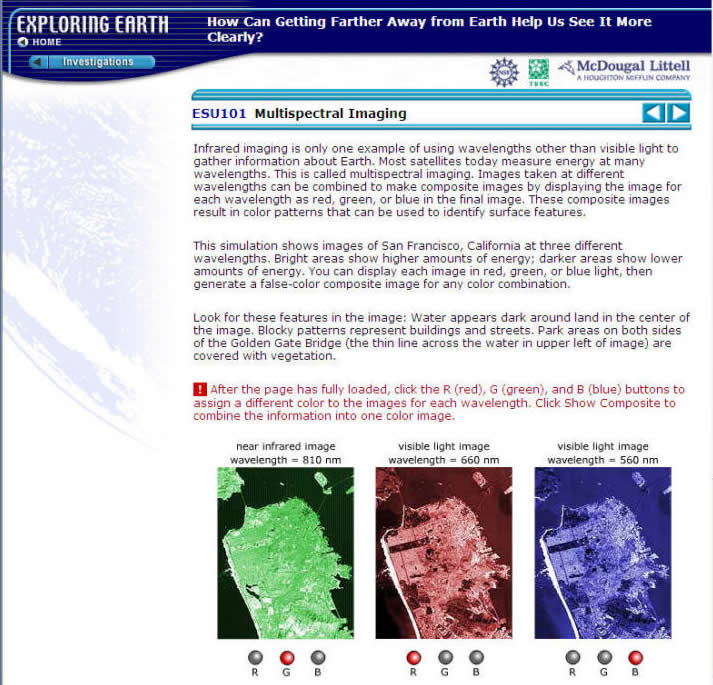
Spectral resolution:
Earth surface cover types have their own characteristics to reflect and emit the radiation.
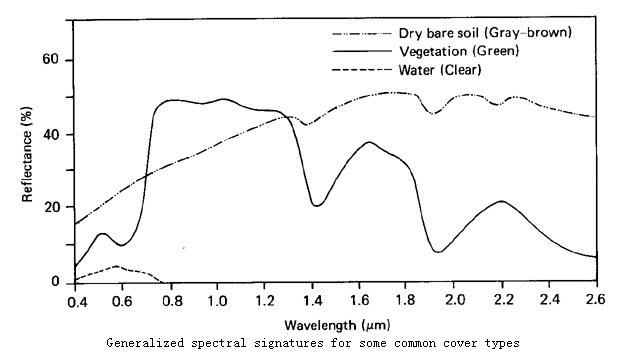
(http://geog.hkbu.edu.hk/virtuallabs/rs/env_backgr_refl.htm)
Video for EMS: http://missionscience.nasa.gov/nasascience/ems_full_video.html
The concept of band: A particular portion in the entire spectrum.
(http://en.wikipedia.org/wiki/Spectral_band)
- Single band
- Multi-spectral
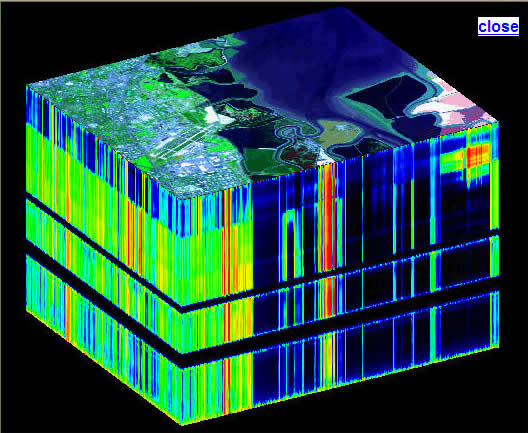
- Hyperspectral systems (numbers of bands to be captured)
Most current satellites have a broad band spectral resolution. For example, AVIRIS Airborne Visible/Infrared Imaging Spectrometer (from NASA/JPL) has 224 bands,
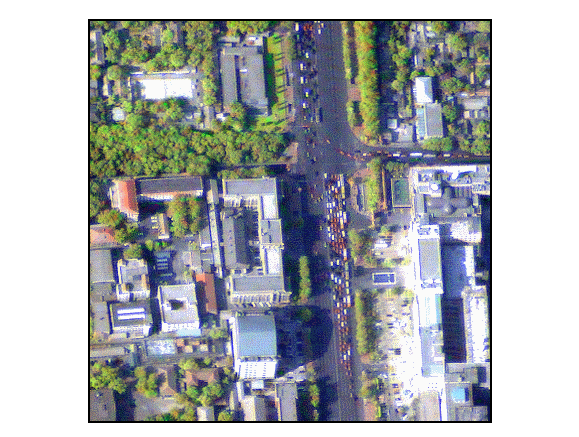
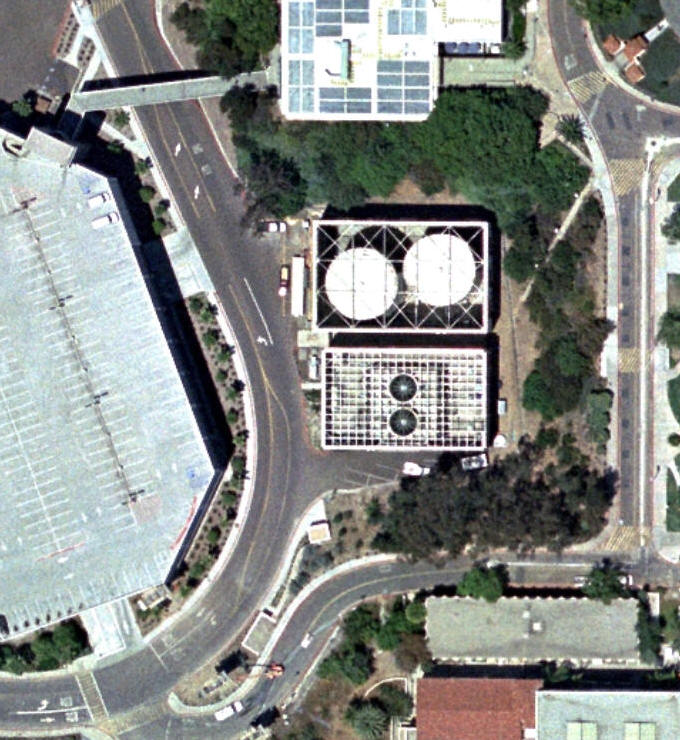
In addition to remote sensing imagery, aerial photography is useful as well.
SDSU Campus Aerial photos (2005).
Temporal Resolution:
(How often to update the information?)
Temporal resolution is related to the time series of images taken from the sky. If the images are taken sparsely in time then the possibility exists that some phenomena will be missed.
The temporal resolution of Landsat is 16 days, FORMOSAT-II is one day, MODIS is every six hours, SPOT is 26 days, and NOAA 4 hours.
|
Radiometric Resolution:
Ability of a sensor to distinguish between objects of similar reflectance. -- 2 bits vs. 8 bits vs. 25 bits
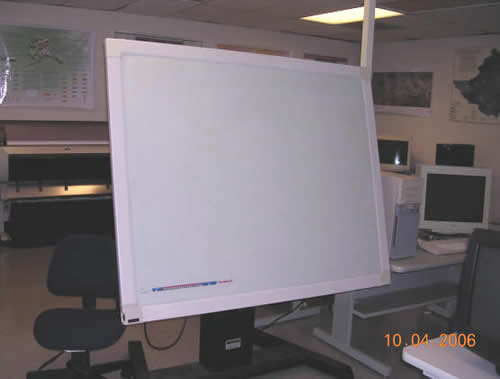
Vector Data Capture:
- GPS
- Surveying
Surveying: Obtaining accurate locations and relative references for geographic objects.
http://oceanservice.noaa.gov/news/features/nov09/directions.html
Data Sharing and Transfer.
Locate geographic data: Internet searching using data cleaning house or data portals.
Example (The ESRI Geographic Network): No longer available
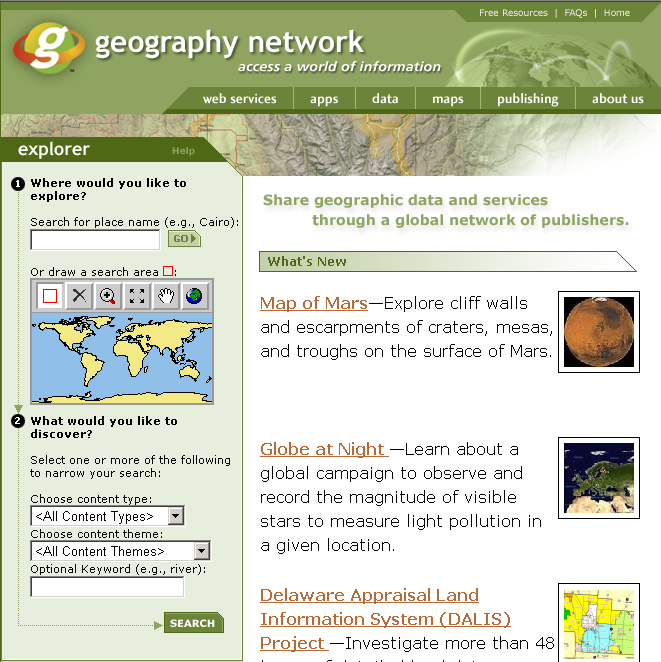
(http://www.geographynetwork.com/)
GIS Format transformation (directly read or translating using intermediate formats).
Two important organizations working on standardization of GIS data: International Standards Organization (ISO) and Open Geospatial Consortium (OGC).
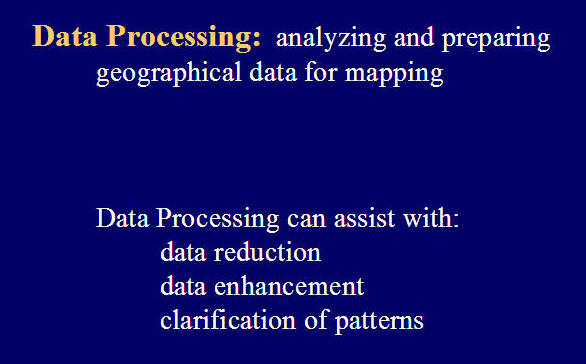
Attribute Data Processing
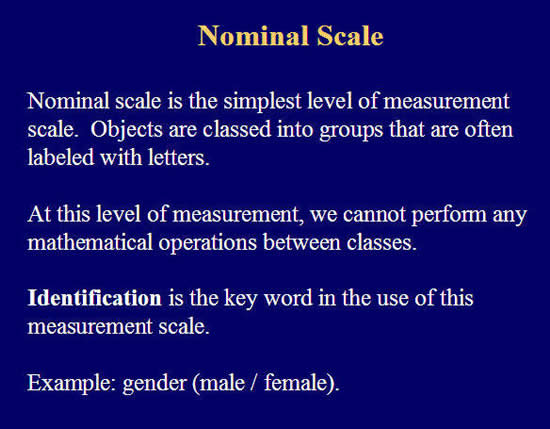
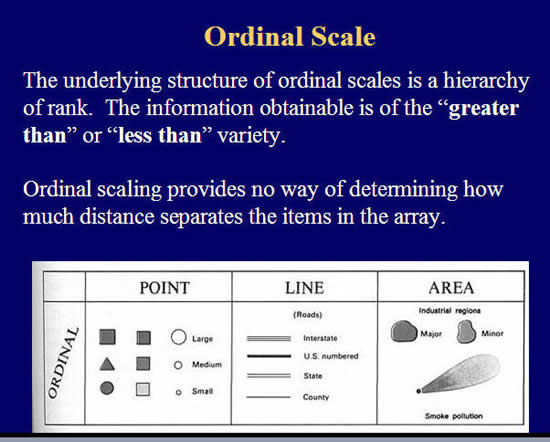
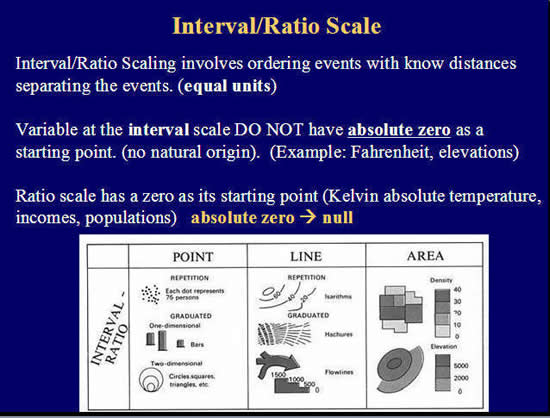
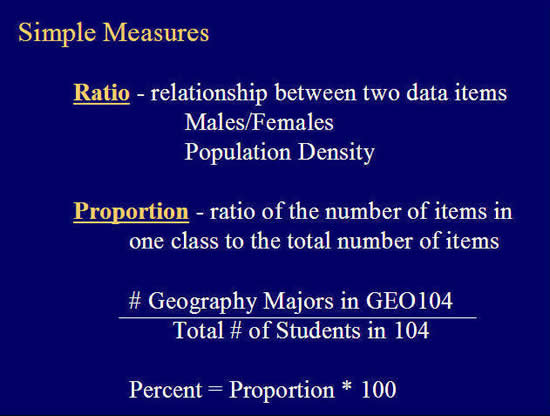
Measurement Scales of Data:
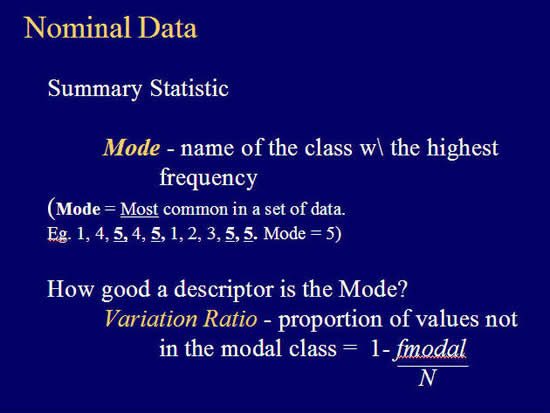
- Nominal Data (examples: cartographer, climatologist, geomorphologist, hydrologist)
- Ordinal Data (brown medal, silver medal, gold medal)
- Interval Data (elevation: 1135 meters)
- Ratio Data (bank account value: $ 1,345)
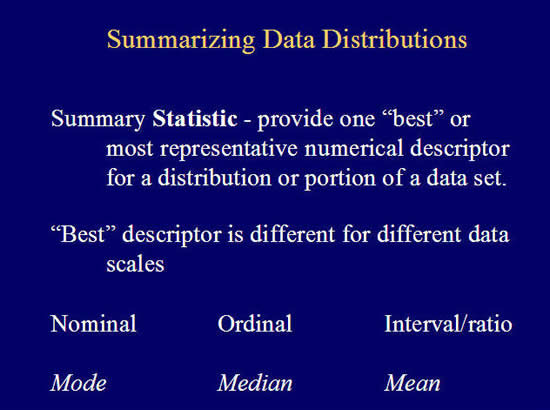
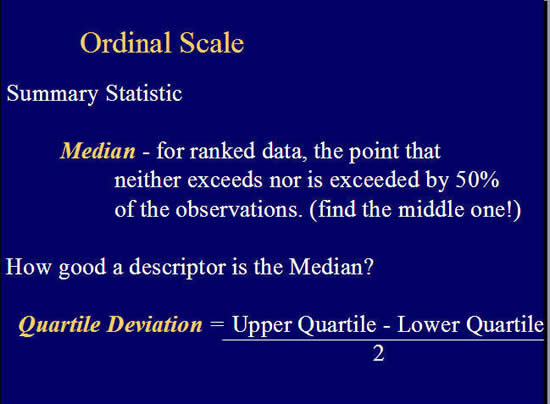
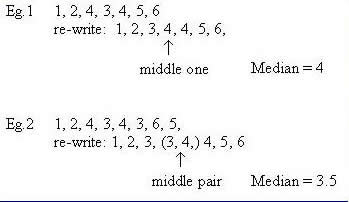
Median:
