GEO 583 Internet Mapping and Distributed GIServices
![]()
![]()
![]()
LAB THREE: Animations + MapBox
Due day: February 15, 9:30am.
10 Points (total 100).
PART 1. Animation Maps
![]()
Download the DEM Data
![]()
1. The first step for today's lab exercise is to download a 7.5 minute USGS DEM in San Diego County from the a DEM Data Archive page at UC-San Diego.
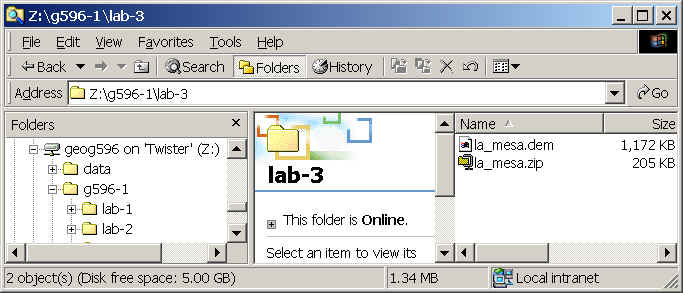
2. Open the File Explorer on your desktop.
3. Create a "lab-3" folder in your root directory (Z:/g583-xx).
4. Navigate to Y:\dem folder to pick up one region DEM file you are interest.
5. Copy the zipped DEM file into your "lab-3" folder.
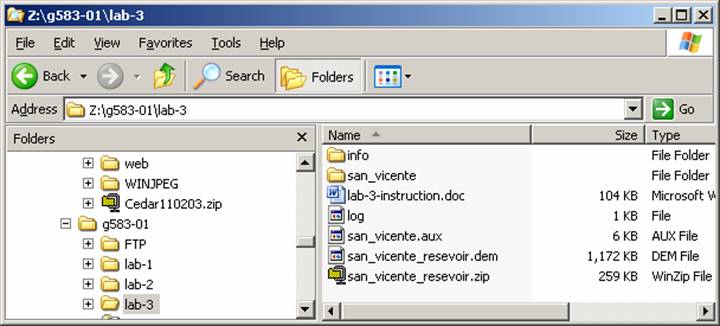
7. After you copy the DEM zip file, click on the [Extract all files] under the Folder Tasks (the left side window)
Press Next à Next à [Finish] to extract files into the "lab-3" folder.
8. The next step is to use the ArcCatalog (from ARCGIS ) to convert the DEM to a ARC/INFO GRID format. Open the [ArcCatalog] program.
First, go to the "Customize" menu --> Extensions --> Check the [V] 3D Analyst extension.
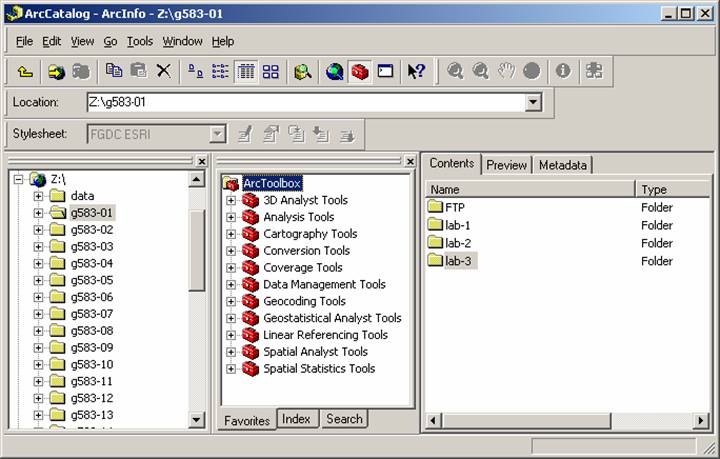
The next step is to connect ArcCatalog to our Z: data drive. Click on [File] menu --< select "Connect Folder..." --> then choose Z: drive, press [O.K.].
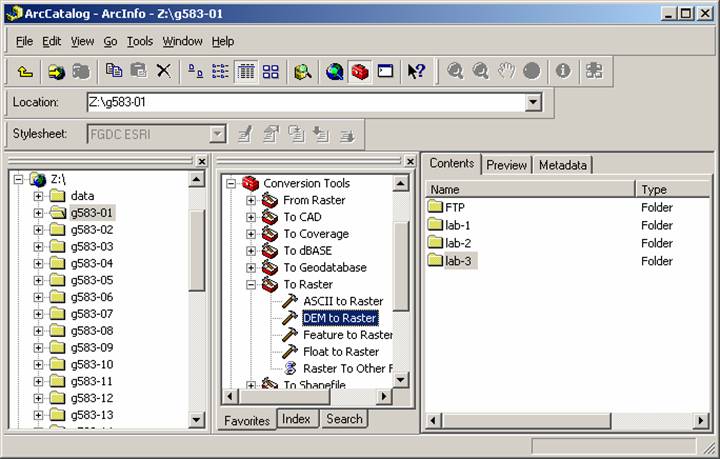
9. In the middle of ArcMap icons, you will see a set of red boxes called "ArcToolbox". (If you didn't see it, click on the RED BOX icon in the tool icons to open it. Select the "Conversion tools" from the ArcToolbox. Then select "To Raster" --> "DEM to Raster". Double click on the icon (DEM to Raster) to open the tool.
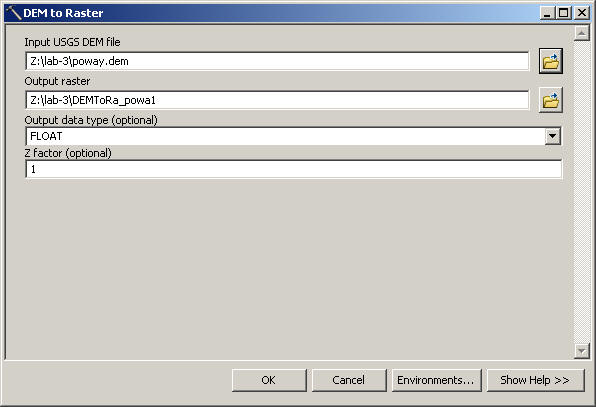
10. After you open the tool, click on the Open file icon (upper one) to navigate to your DEM file "Z:\lab-3\areanames.dem" (or Z:\lab-3\areaname\areaname.dem) and type in "Z:\lab-3\DEMToRa_areaname" as your OUTPUT raster (Note: the OUTPUT File name should be no longer than 13 characters.) Then press [OK] to convert the DEM.
(If you got some error messages, you need to re-do the Download/Uncompress procedures 4-7.)
11. Next, click on the [3D Analyst Tools] --> [Conversion] --> Raster to TIN.
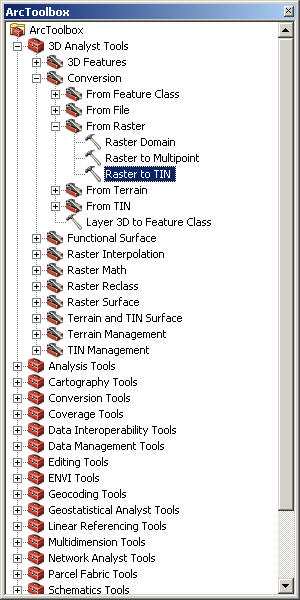
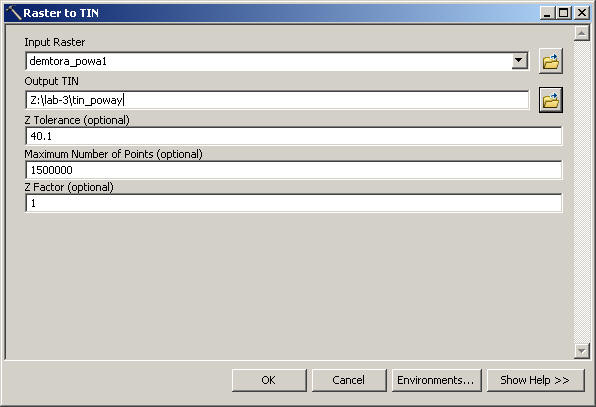
Open the [Raster to TIN] Tool, select the raster input file [demtora_areaname] , output TIN: Z:\lab-3\tin_area
Click on [OK] to create the TIN file.
11. After the conversion, close the ArctoolBox. [Tool] -- [Exit]. And use the File Explorer to check if the new grid file exist in your "lab-3" folder.
![]()
Create 3D Views
![]()
Now We will use ArcGIS -- ArcScene 10.3.1 to generate 3D Views.
Open ArcScene 10.3.1 Program first.
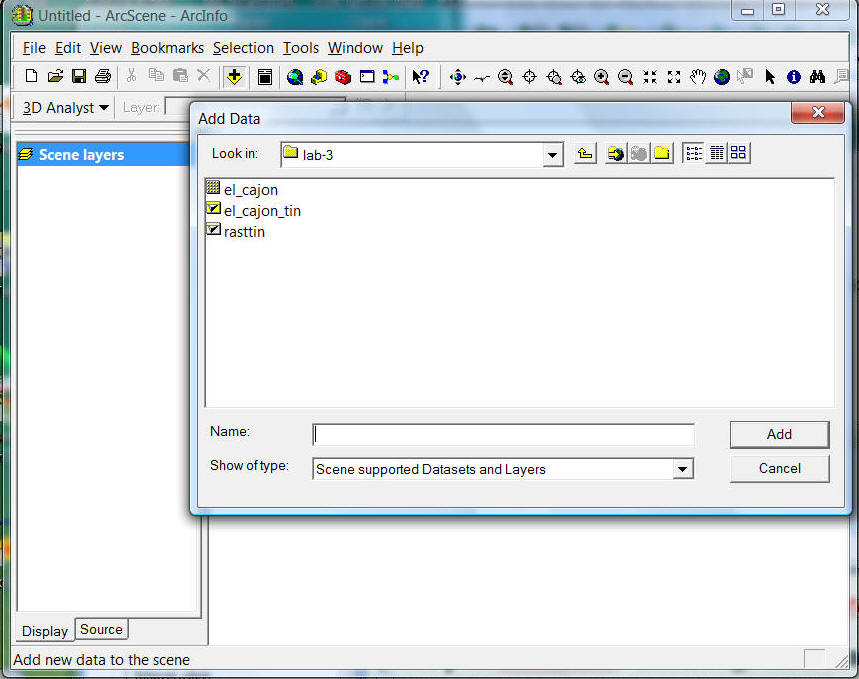
1. Click on the "Add Data" icon (the Yellow one with the plus sign). Navigate to the Z: drive\lab-3 folder.
2. Add the DEM and the TIN model into the ArcScene.
3. There are two ways to create a nice 3D view (use TIN or the DEM layer). We will only teach you the DEM layer here. You can also create the 3D view by using TIN if you are familiar with ArcScene.
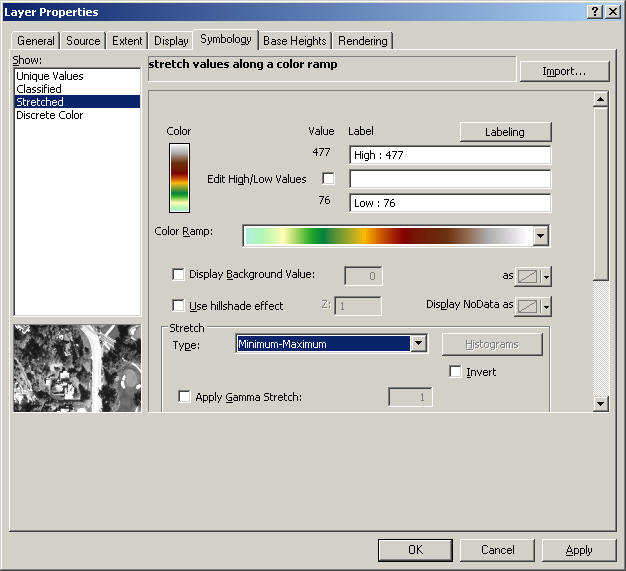
4. To use the DEM layer, uncheck the TIN layer. Then open the "Property" window of the DEM layer by "Right click" on the layer name and select the [Properties..].
5. Switch the "tab" to the "Symbology". Right click on the "Color Ramp" box and uncheck the [Graphic View]. Now the Color Ramp has switch to "TEXT view". Select the [Elevation#1] for your DEM view.
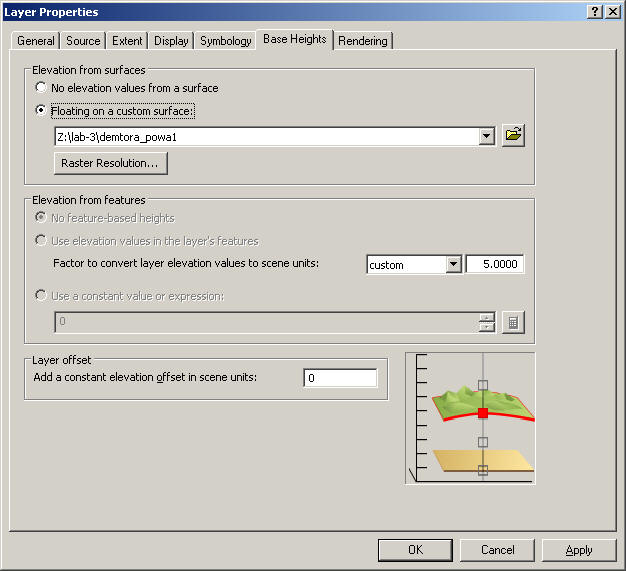
6. Now switch to the [Base Heights] Tab and we will make the DEM layer 3D according to its value.
In the Height box, switch the select to [X] Obtain heights for layer from surface:. Keep the original DEM value.
The original DEM value may be too "smooth" for visualization purpose. We can exaggerate the Z value by change the "Z Unit Conversion"
--> Change the Z Unit Conversion value --> Custom --> [3]
Click [OK] at the bottom.
Now you will see the 3D view of the DEM in ArcScene.
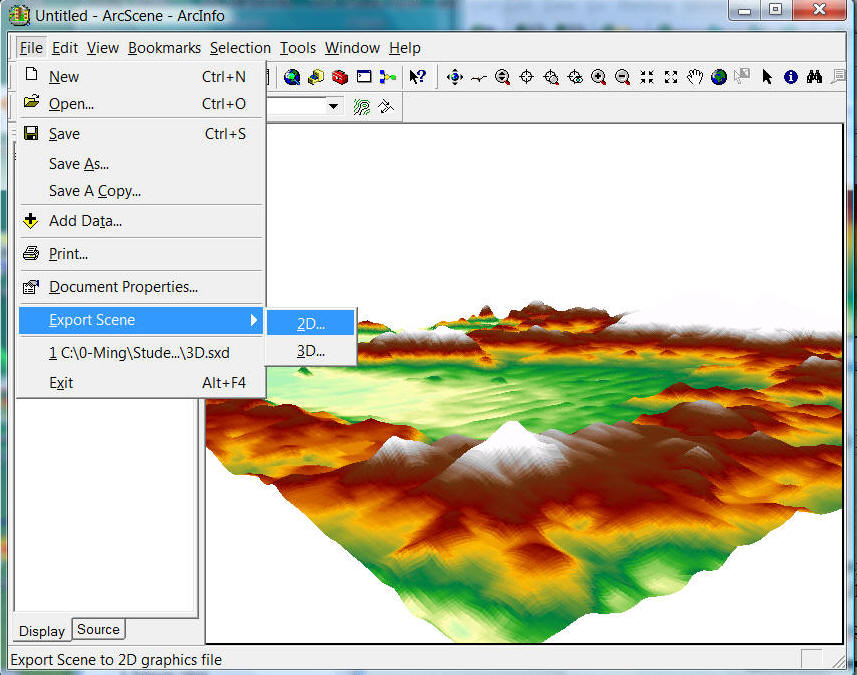
7. The next step is to create a series of snap shots from the 3D DEM view.
To create a snap shot, Select [File] ==> Export Scene --> 2D. (DO NOT select 3D because we are not creating KML files).
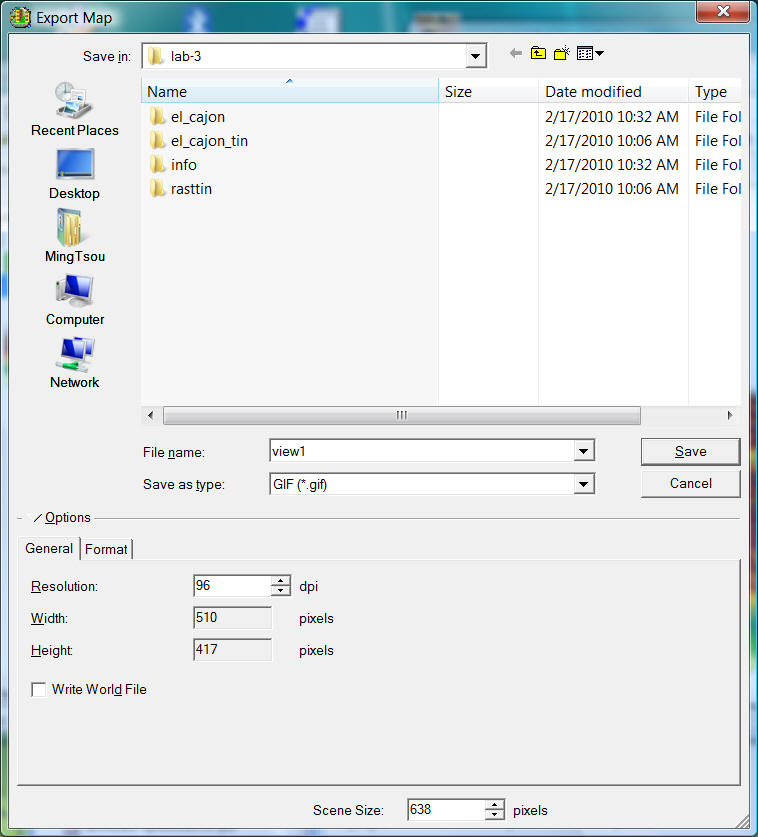
8. Change the "Save in" directory to Z: \lab-3. Change the [Save as type] to "GIF". The [File name] should be "view1".
After saving the first image, slightly move the 3D view, save the second image as "view2", then the third image as "view3".
Repeat the process for your animation series (probably 6 - 8 images).
After you generate these consecutive pictures, save your 3D ArcScene project in the "lab-3" folder as "3d-lastname.sxd". Then Exit ArcScene.
![]()
Create a Animated GIF picture
![]()
The next step is to use a software called "MS GIF Animator" to create the animated GIF picture..
Navigate to the "Y:\Microsoft GIF Animator" folder and double click on the GIFAnimator.exe
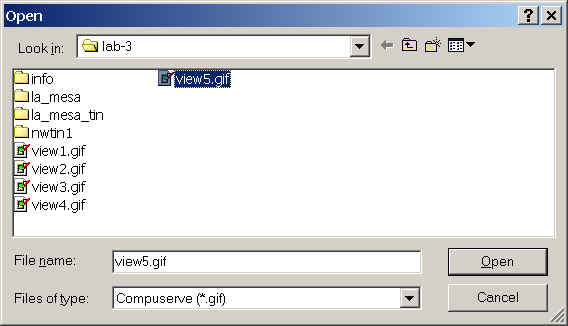
Click on the open icon (the second one) and open the "view5.gif" image first. (Make sure you open the "view5.gif", not "view1.gif".
Click on the [Insert] icon (the fourth icon from left) to insert the rest of image: view4, view3, view2 and view1.
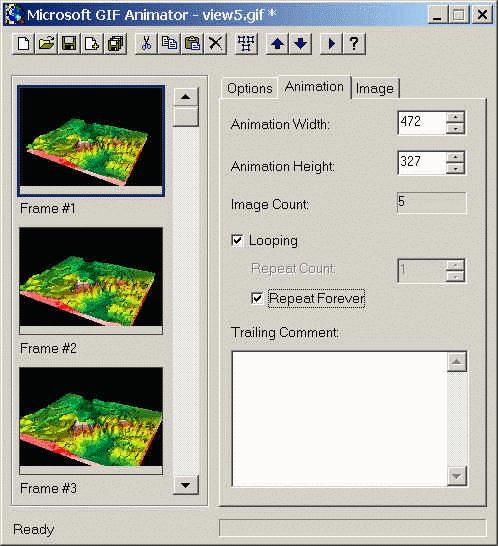
Click on the "Animation" tab and check out [Looping] and [Repeat Forever].
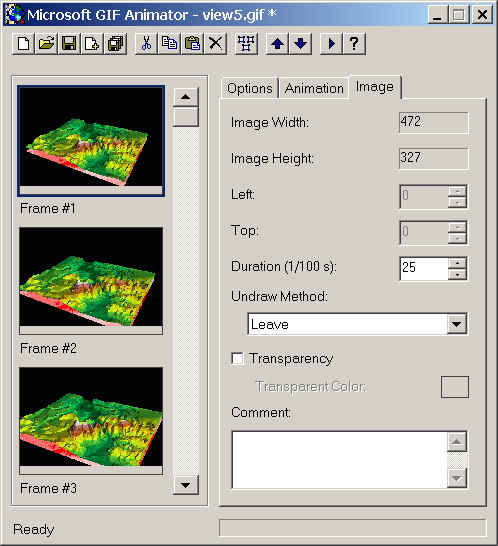
12. Click on the "Image" tab and change the value of "Duration" to 20 or 30 (1/100s).
NOTE: You need to click on EACH frame (Frame#1, Frame#2, Frame#3, Frame#4) to change the individual "Duration" time. Otherwise, the default duration is "0" for the rest of images and your animation will become too fast.
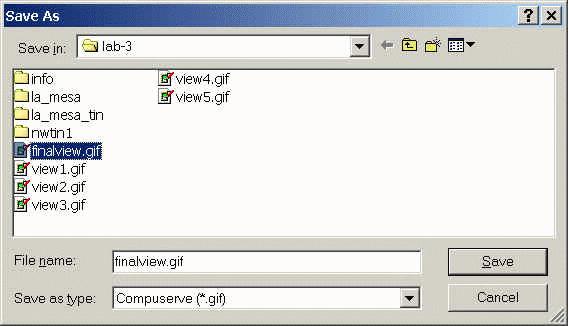
13. After the change of animation parameters, click on the "Save as" icon (the fifth from left) and save the final GIF picture in your lab-3 folder as "finalview.gif".
14. The next step is to open your previous Webpage from last week and add this new picture.
15. Open the Microsoft Expression Web first.
16. Make sure the Expression Web is displaying your [Web-lastname] directory on Z: drive (You can see that your web folder has different icon to indicate that the folder is a web directory.
17. Double click on the "index.htm" to open your Web editor window.
18. Move the mouse cursor to the bottom of the web page. Then Select [Inset] -- [Picture] -- [From File] and navigate to your "lab-3" folder to insert the "finalview.gif" into you web.
19. Use the Preview Web Browser window (Press F-12 key) to see if the animated GIF works.
20. Publish your web to the student web server again. (The same procedure from the last week).
Use WinSCP. Make sure to upload files ONLY within the "Web-Yourname" folder.
21. Now you can check if your animation picture works:
HTTP://mappingideas.sdsu.edu/583student
Navigate through your own folder and see your new website.
![]()
Some Tips for improving your design:
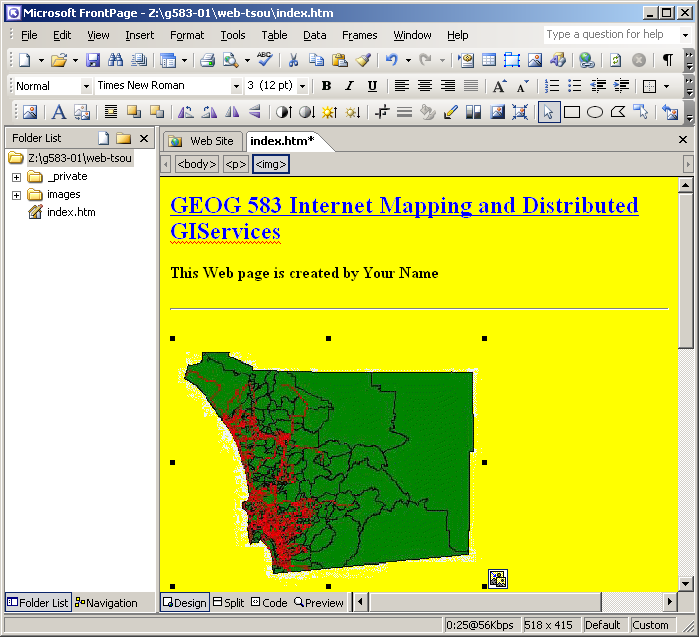
1. Make the picture background transparent (For example, your first San Diego map). Use the picture tool under the editor window "transparent tool" (looks like a magic stick). and apply the tool into you picture.
2. RESIZE your images:
You can RESIZE your image by move the cursor around the image corners.
Note: If you resize your pictures, sometime the quality of the picture may be reduced due to the pixels changes. You can try the "RESAMPLE" function to adjust the picture quality.

(Note: if you can not find the resample function and the "picture toolbars", click on the [View] menu from the Frontpage, select --> toolbar ---> select the [Picture] toolbar. The picture toolbar will popup on the screen, you can re-arrange the location of these toolbars in Frontpage.)
![]()
Part 2. Mapbox Studio Introduction
| Scroll down to "Tilesets" (This is the data layer in MapBox). | |
| Click on [New tileset] | |
| Select a file à go to the downloaded data folder (from shared Google Drive) à COLLEGE.zip (downloaded originally from SANDAG). à Upload | |
| Now you will see a new "tileset", called "COLLEGES" is available now. | |
| The next step is to create a style for your college map. | |
| Click on Style Menu à "New style". à "Dark" à Create. | |
| Now the Map Studio Design Window open. | |
| Click on "+ New layer" à Source à select "College" in the bottom list. | |
| Click on "Create layer" . | |
| In the Style tab, click on the "Color attributes" and select a vivid color for our college points (see image below). |
| Now we like to add a text label on the college data points. | |
| Click on "Duplicate 1 layer" icon à a new "college copy" was created. |
| Now we can rename this new layer à In the top label name, change to "college labels" (see the image below). |
| Then click on the "Select data" tab (next to "Style"). | |
| Select "T symbol" à Okay. | |
| Switch back to "Style" à click on Text field [none] à select "ShortName", | |
| Change the "Color attributes" to vivid color you select. | |
| Now you can try to zoom in your map window to San Diego to preview your map. |
| You can also adjust the Text position in their tools. | |
| Select "Position" à Text anchor à upper-left one. | |
| Now you can publish this map into MapBox. | |
| Click on the "Publish" button (Purple color). | |
| Click on "Publish" in the Popup Window. Congratulations! Your first MapBox map has been published. Click on "Share, develop & use" | |
| Your map has been published online !! | |
| You can copy the share URL to any web page or browser to view your map. |
![]()
4. What to turn in
![]()
|
Publish your animation GIF picture on your Web page. | |
|
| |
|
Publish your Mapbox Web Map on your Web page. |
|
Use the Blackboard online forum to answer the following questions (and then Print out a Paper copy for the Instructor):
|
1. Compare the different design issues between the SANDAG (http://www.sandag.org/index.asp?subclassid=100&fuseaction=home.subclasshome) Data Archive Center and NYS GIS Clearinghouse http://gis.ny.gov/?nysgis= What's the differences between their web design, data categories, download procedures, access limits, and potential users?
2. What are the differences between the GIS data archive centers and the GIS data clearinghouse? What is NSDI?
3. Use on-line search engine (Google) to find a brief explanations of the followings and one example for these technologies or applications.
|
SOAP and UDDI | |
|
Java Applets and Java Servlets | |
|
CGI | |
|
Active Server Page (ASP). |
![]()
![]()
![]()
![]()
![]()