GEO 583 Internet Mapping and Distributed GIServices
LAB TWO: Microsoft Express Web 4 Tutorial
Created and Updated by Dr. Ming-Hsiang
Tsou,
Department of Geography, San Diego State University
Due day: Feb. 8
10 Points (total 100).
ArcGIS 10.5 Desktop One Year Student License Available upon Request.
Tableau Software Free license for this semester.
Learning ArcGIS Desktop (for ArcGIS 10.0) Training Course Available upon Request.
![]()
1. Download Spatial Data from The Internet
![]()
1. Logon on the workstation by using your own account and password.
2. Right click the [Start] menu and select [Explore] to open the File Explorer on your desktop.
3. Create a "lab-2" folder in your root directory (Z:\lab-2).
4. Right Click the following SanDAG HyperLink and select [Open in New Window] to open the Web Site:
http://www.sandag.org/index.asp?subclassid=100&fuseaction=home.subclasshome
Click on the "Regional GIS Data Warehouse" link (orange color).
You will need to Register as a new user first. After the registration, you can enter their web portal.
5. Read the "GIS Data End User Agreement...." (bottom middle link) . Spend 5 minutes to read the explanation and the data download procedures. --
7. Now let's try to download the Census Boundary. Click on the [Census] category.
8. Right Click on the "Census Tracts 2010.zip" and select [Save Link as] -->
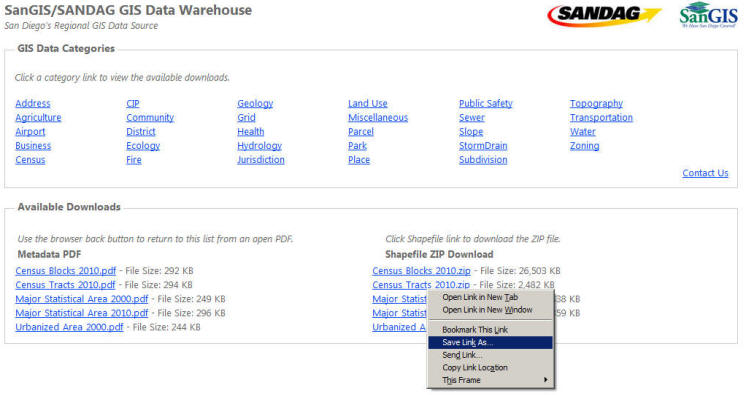
9. A new window will pop up and press [Save] to save this file to disk.
10. In the [Save as] window, Navigate to your geog583 on Twister (Z)): drive and to "lab-2" folder.
11. Click on [Save].
12. After the download, Open the File Explorer, Select the CENSUS_TRACKS_2010.zip, Right click on the file, --> Extract ALL --> Use the default path for the Extract Files.
(Note The Shapefile is a popular GIS data format created by ESRI).
![]()
Generate a View-only Map (picture)
![]()
Now review the whole process and try to down load another layer (your own selection) into your lab-2 folder. (You can select ONE additional layer from their list, such as highway, roads, river.... from the SanDAG Data Archives). After that, continue the following steps:
Open the ArcMap 10.4. from your Desktop. or ArcView 3.3. Use Blank Template.
(Note: ArcMap 10.3 will take 5 - 8 minutes to load. Please be patient. ArcView will launch immediately. ArcView is an old version of ArcMap.)
1. Add the two GIS layers from SANDAG into the ArcMap or ArcView.
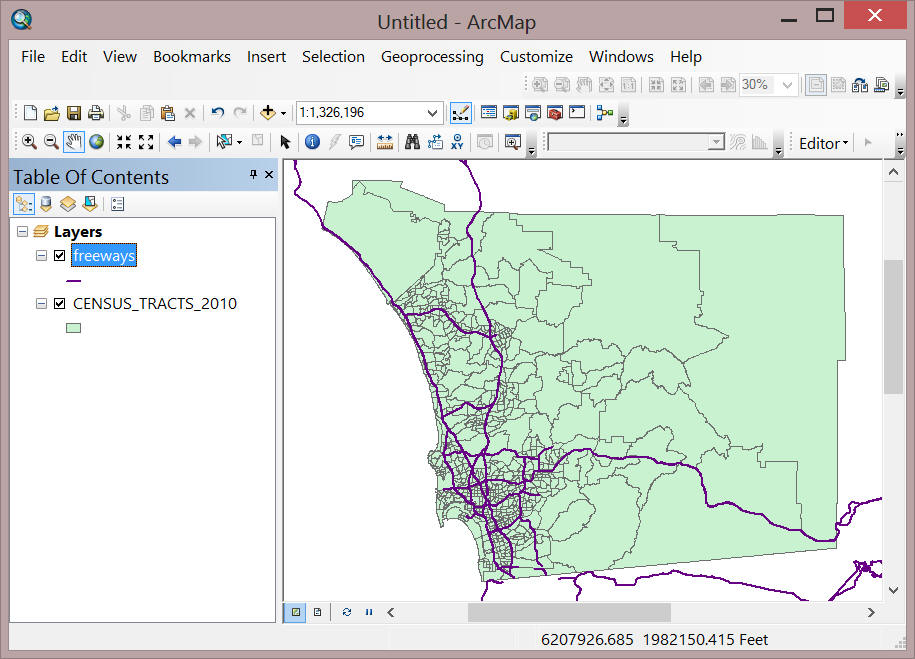
2. Now try to change the symbols and design of your view to make it more attractive. When you manipulate the ArcMap, try to think about its Graphic User Interface. What's the functions of map symbols in here? Try the "identify" functions and "highlight" a few map areas.
3. After you finish the design, the next step is to generate the map picture. There are two ways to create map pictures. Please try both ways to generate your map pictures.
4. The first way is to select [File] --[Export Map] -- and change the File type to [JPEG] and type "lab2-1" to export the map to a JPEG picture ( JPEG is the compressed picture format and the most popular picture format for the Web).
5. The second way is to create a screen shot from the ArcMap or ArcView directly. To do so, hold on [Alt] key , then press [Print screen] key. Now you just copy the image of ArcView program into a cache memory.
6. Open the [Paint] software. After you open the [Paint] program, select [File] -- [New]
Then click on the "Paste" icon --> [Paste] to copy your screen shot to the file. Answer [Yes] to enlarge the picture if necessary.
7.Click on the "Save" icon --> Save the screen shot as "lab2-2.jpg" into your [Z:\g583-xx\lab-2] folder. Close the Paint program.
8. The next step is to save your ArcMap file into the "Z:\g583-xx\lab-2" folder by using [File] menu -- [Save project As] -- "lab-2-lastname". Then close the ArcMap.
Now you generate two map pictures and we will use the two picture for the FrontPage tutorial design later.
![]()
4. Microsoft Expression Web Tutorial
![]()
Microsoft Expression Web is an integrated Web authoring and publishing software. Here is the major advantage for Expression Web.
|
Graphically visualize and organize a complex web. | |
|
Create and edit web page in a WYSIWYG (What you see is what you get) environment. | |
|
Quickly create and organize an entire web. | |
|
Easily add interactive functions and scripting functions. |
Now let's start the tutorial:
NOTE: The following tutorial is for the old version of Expression Web, called "Front Page". The interfaces between Front Page and Expression Web are very similar. Please do your best to follow the instruction to complete these tasks.
1. Open the Expression Web from the Desktop Apps
2. When the Expression Web open, Click on the "New Site" icon on the upper left corner (the second icon).
Then select the - [One page site]
Under the "Location:" type "Z:\web-yourlastname\" as the location of your new website. Then Choose [OK].
(NOTE: DO NOT add "g583-0#" in the file path, Just "Z:\web-yourlastname") The following picture path is incorrect.)
4. Expression Web will create a sub-folder in your directory and a several default files and folders (such as "images" and "_private". The default Home page name is "default.htm".
5. Please rename this file from "default.htm" to "index.htm". (right click the file to rename it).
(Every time when a Web browser access your home page folder, the "index.htm" or default.htm" is always the first file they will launch. Some Unix web server may use "default.html" as the default launch web page and most Windows server will use index.htm as the default web page.).
5. Double click on the "index.htm".
The editor window will have four options "Design", "Split", "Code" . You can begin to edit your Web page now. Type the following text into the editor.
Type "GEOG 583 Internet Mapping and Distributed GIServices" (Press Enter), then type "This Web page is created by Your Name."
6. The next step is to change the size of your title. Highlight the title "GEOG 583 Internet Mapping and Distributed GIServices" then change the font to level Large (18 pt). with GREEN color. (to change the color of font, you can select [Format] menu --> [Fonts] to change. You can also use the tools on the top.
7. Move the mouse cursor after the title, then Select [Insert] menu -- HTML --> [Horizontal line] to put a line between the title and the body.
Now we want to insert the map picture we just created into your web page. Select [Insert] -- [Picture] -- [from File].
Navigate to your "lab-2" folder and choose "lab2-1.jpg". Press [OK] to insert the image to your Web page. Please type alternative text (briefly descript the content of this image map)
8. Now your Web page should look like this:
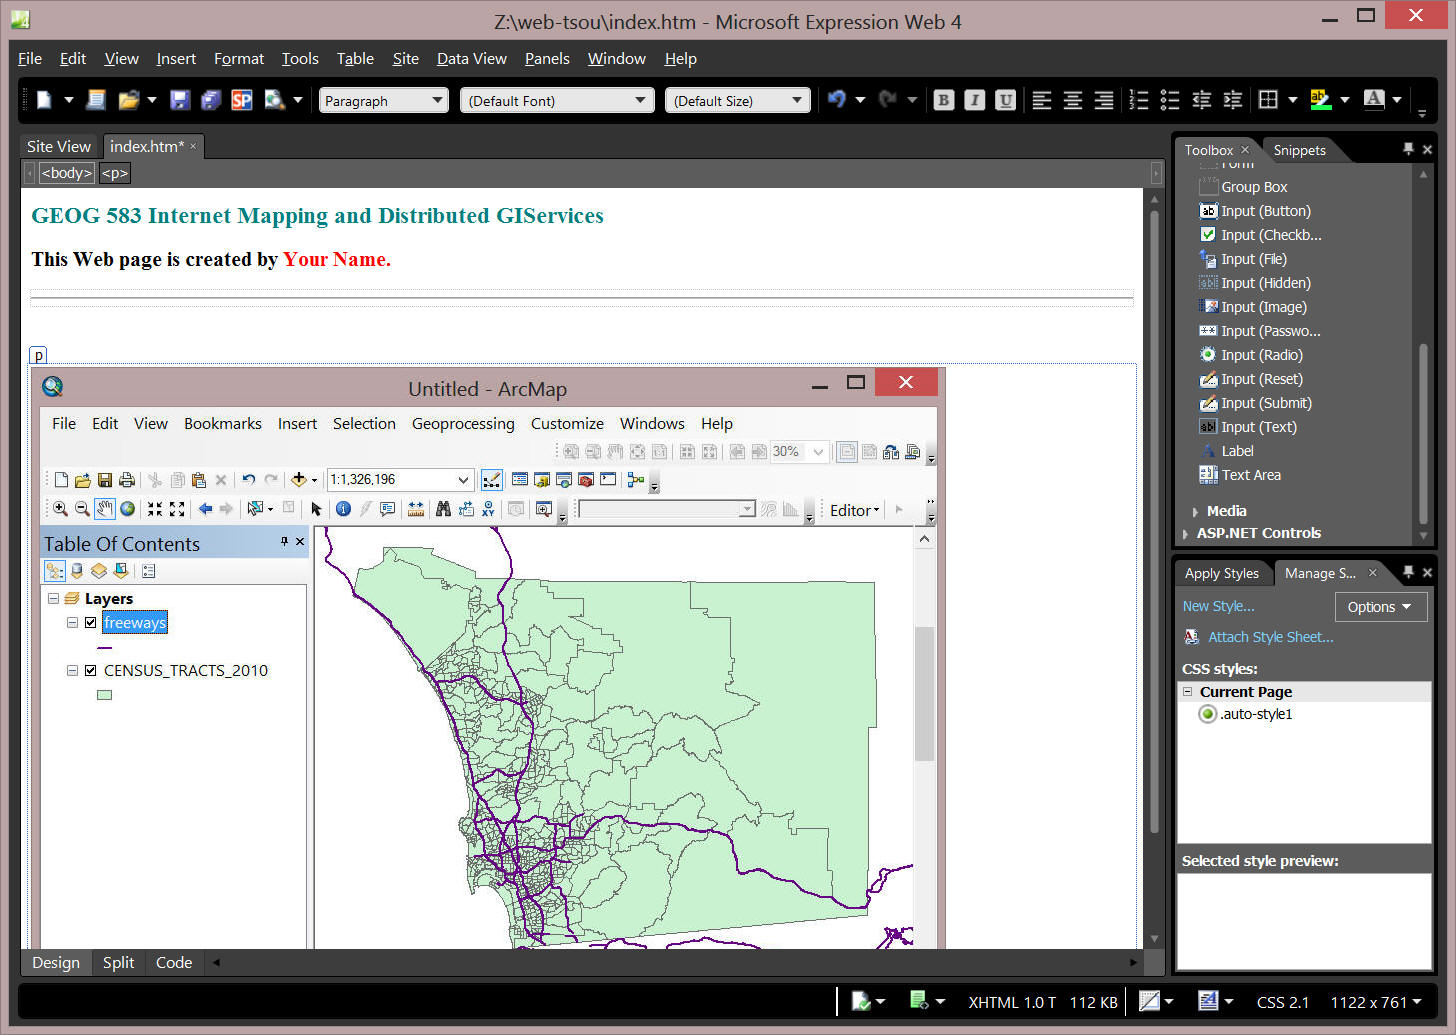
You can RESIZE your image by move the cursor around the image corners.
Note: If you resize your pictures, sometime the quality of the picture may be reduced due to the pixels changes. You can try the "Picture Action" function (when you move your mouse coursor to the lower-right corner of the picture to adjust the picture quality.


(Note: if you can not find the resample function and the "picture toolbars", click on the [View] menu , select --> Toolbar ---> select the [Picture] toolbar. The picture toolbar will popup on the screen, you can re-arrange the location of these toolbars )
9. Add the second image "lab2-2,jpg" into the index.htm (below the first image). Put your own explanation of statistic maps and related texts on your web design. Now you have two images embedded in a single web page..
10. When you finish your design, you can use the "Code" Mode to see your Web page by clicking on the bottom tab in the Expression Window. The following screen is an example of "Code" mode window.
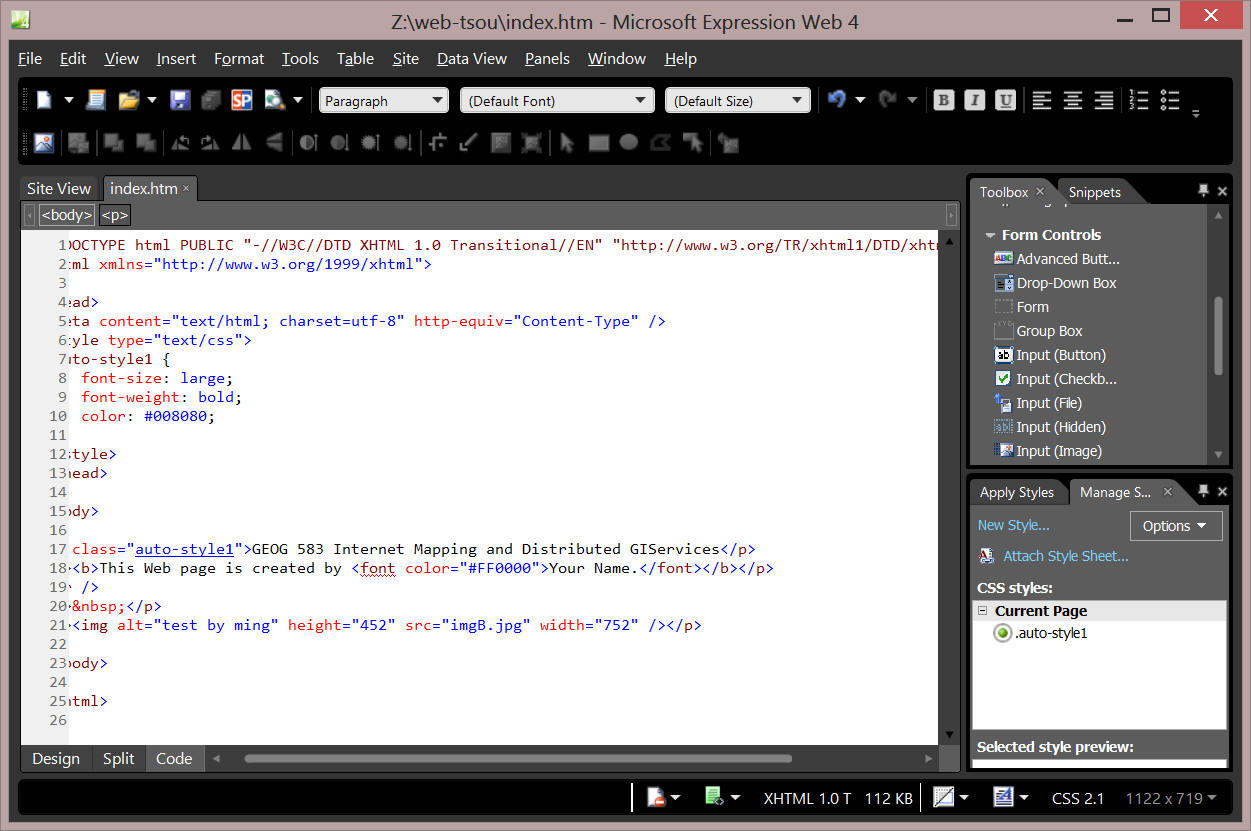
To preview the web page, you can select [File] menu --> "Preview in Browser" -- select the browser to preview. Or you can use the Super Preview function.
11. Now we need to do a final touch for your design. Add a new text Title and a background. First, Switch back to the [Design] viewer by clicking on the [Design] tag. Move your move cursor in the Web editor window (the window showing your HTML pages, "GEOG 583... " with pictures..) and click the right button to select [Page Properties] window. Now change the Title to "GEOG 583: Lab-2 by Your full name".

12. The next thing is to click on tabl of [Formatting], then select the "Background icon", and switch to the background page. Choose your own background color and press [OK].


13. Now we want to create a hyperlink to our class web page. Highlight the "GEOG 583..." in the Editor and press [CTRL-K] (or select "Insert" menu -- "Hyperlink"). Type "http://map.sdsu.edu/geog583" into the URL box and press OK.

14. Now we finish the design of our lab2 web. Your Expression Web 4 editor should look like this.
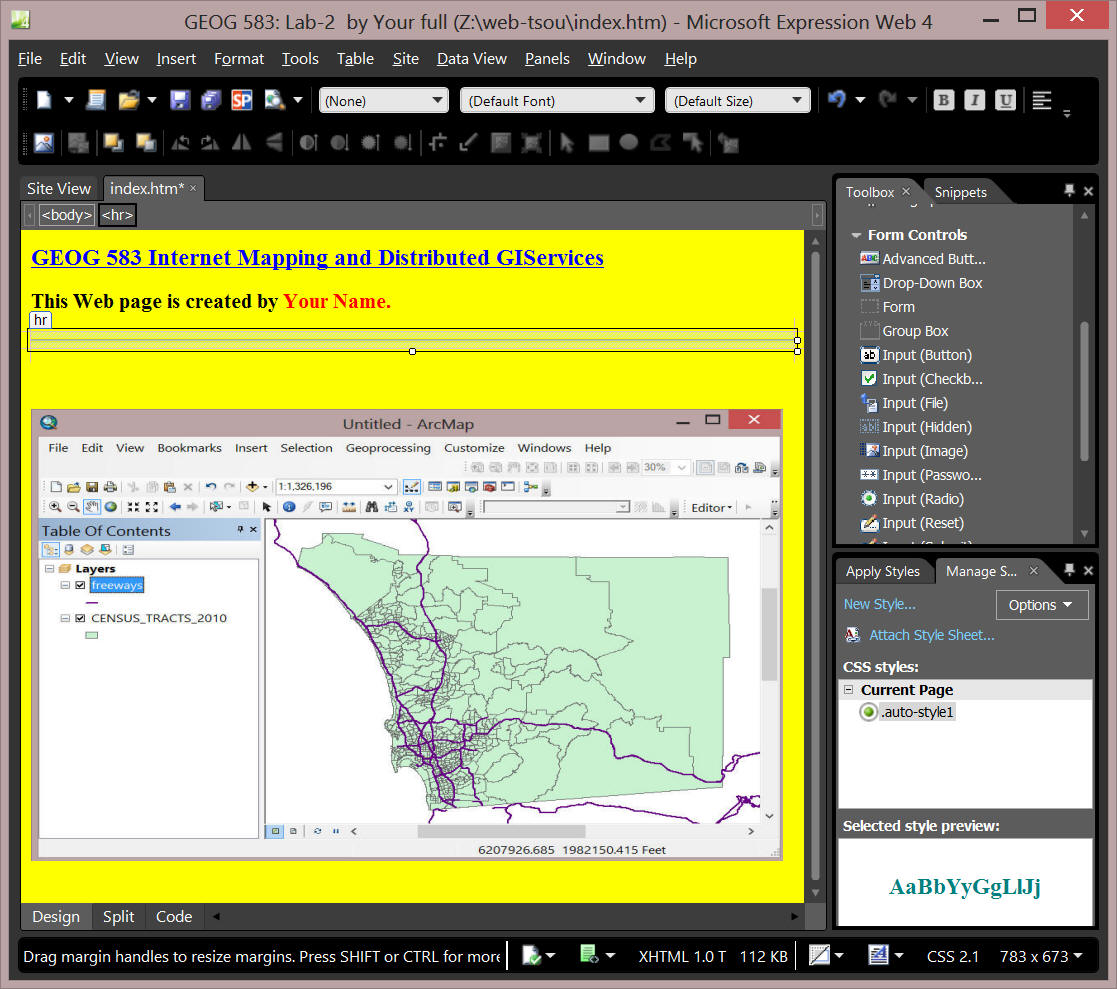
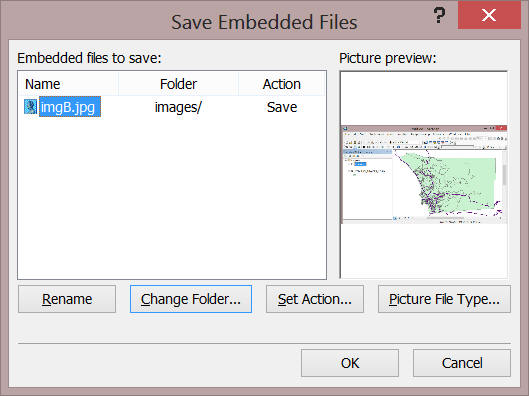
15, Before you publish your web, you have to "SAVE" it first. Select [File] menu -- [Save]. Expression Web will ask you if you want to save the images into the same folder. Please choose the "Change Folder" button and then create a new "image" folder first. Then save these JPEG files into the "images" folder. A good web designer will keep their files and images well organized.
16. Now this is it! You will publish the Frontpage web into the actual web server.
Now, please open the File Explorer to double check if you save your WEBSITE into the right folder. Click on the Z: Drive
You should see the folder "web-YOURNAME" under the Z drive along with [lab-1] and [lab-2] folder. If you can not find it. you may save the website into other place. Find the folder and copy it back to the right place.

Now Please use the WINSCP (SSH FTP) software to publish your website.
1. Open the WIMSCP.

2. On the Left side window (local), click on the "web-Yourname" and enter your website folder.
Now. You need to upload all files and folder from the website folder into the remote server folder.
Select all items and then move them to the right side.

17. Now you can check out your page:
HTTP://mappingideas.sdsu.edu/583student
Navigate through your own folder and see your new website.
![]()
4. What to turn in
![]()
|
The final version of your Website in both Web browser format and HTML format. (Use your Web Browser to print out the Web page and select [View] menu -- [Source] to print out the original HTML text. |
|
Use the Blackboard Forum to answer to the following questions and print out a paper copy for submission: |
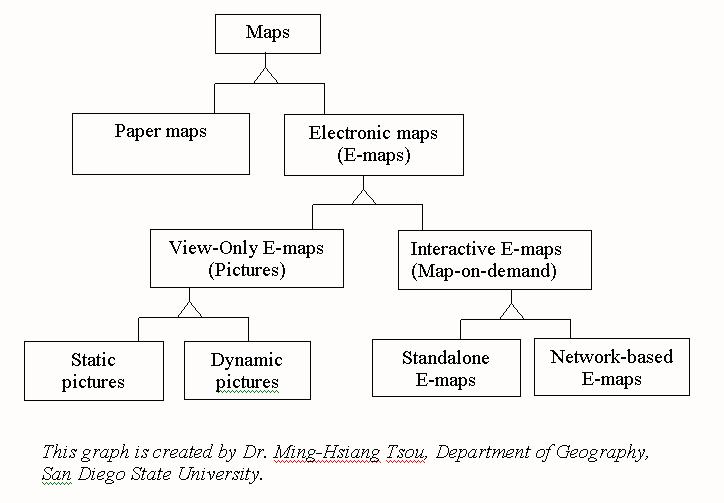
1. Do you think the classification of maps in the following graph is appropriate? or not? Try to find out some examples to support your arguments. (For examples, is there any "hybrid" map which is in both category-A and category-B? )
2. Compare the differences between the text-based HTML editing (lab-1) and FrontPage exercise (lab-2) for Web authoring. What are the advantages and disadvantages for both approaches. Which one do you prefer? and Why?
3. In the future, the major task for "cartographers" may be the design of user interface. Please introduce one example of user interface in your on-line answers (the examples could from computer games, GIS software, or office packages.... also from the hardware devices, like Joysticks, Gamepad, etc.). Make a screen shot of your user interface and save the images into your own "lab-2" folders. We will show your own example to the class member next time.
![]()