
GEOG 581: Cartography Design

![]()
![]()
Cognitive Science
![]()
The focus of How maps work (process-focus), not What types of maps works (which one is the best, optimal map).
![]()
Examples: Why we adopt this color scheme for elevation? How does our vision work to give us the information about the terrain?
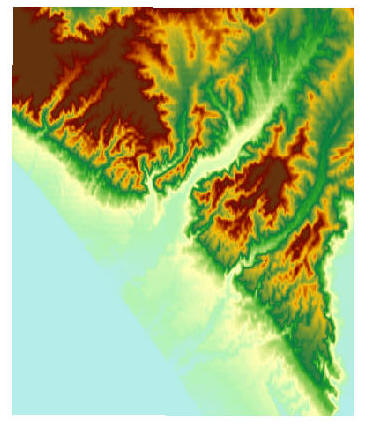
(advance and retreat color scheme: reds for high elevations to blues for a low elevation...)
http://www.cyber-prof.com/mdia1194/Lesson%203/lesson3-optical-illusions.htm
Visualization of Information ( http://dvl.sdsc.edu/chromadepth/ )
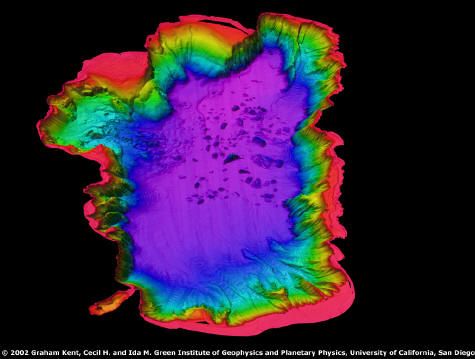
What is Cognitive Science?
"Cognitive science is the interdisciplinary study of mind and intelligence, embracing philosophy, psychology, artificial intelligence, neuroscience, linguistics, and anthropology. Its intellectual origins are in the mid-1950s when researchers in several fields began to develop theories of mind based on complex representations and computational procedures. Its organizational origins are in the mid-1970s when the Cognitive Science Society was formed and the journal Cognitive Science began. Since then, more than sixty universities in North America and Europe have established cognitive science programs and many others have instituted courses in cognitive science.
The central hypothesis of cognitive science is that thinking can best be understood in terms of representational structures in the mind and computational procedures that operate on those structures. ...Most work in cognitive science assumes that the mind has mental representations analogous to computer data structures, and computational procedures similar to computational algorithms. Cognitive theorists have proposed that the mind contains such mental representations as logical propositions, rules, concepts, images, and analogies, and that it uses mental procedures such as deduction, search, matching, rotating, and retrieval. The dominant mind-computer analogy in cognitive science has taken on a novel twist from the use of another analog, the brain.
Connectionists have proposed novel ideas about representation and computation that use neurons and their connections as inspirations for data structures, and neuron firing and spreading activation as inspirations for algorithms.
"
(Cited from http://plato.stanford.edu/entries/cognitive-science/)
Cognitive Science pursues a scientific understanding of the mind through all available methodologies, notably those of anthropology, artificial intelligence, computer science, education, linguistics, logic, neuroscience, philosophy and psychology, in whatever combinations are most appropriate to the topic at hand. --Annual Meeting of the Cognitive Science Society
(Cited from http://cogweb.ucla.edu/CogSci/ )
The claim that human minds work by representation and computation is an empirical conjecture and might be wrong. Although the computational-representational approach to cognitive science has been successful in explaining many aspects of human problem solving, learning, and language use, some philosophical critics such as Hubert Dreyfus (1992) and John Searle (1992) have claimed that this approach is fundamentally mistaken. Critics of cognitive science have offered such challenges as:
Thagard (1996) argues that all these challenges can best be met by expanding and supplementing the computational-representational approach, not by abandoning it.
![]()
The Differences between Vision and Cognition?
Vision: a vivid mental image, an imagined picturing originating with
Cognition: The term cognition is used in several different loosely related ways. In psychology it is used to refer to the mental processes of an individual, with particular relation to a view that argues that the mind has internal mental states (such as beliefs, desires and intentions) and can be understood in terms of information processing, especially when a lot of abstraction or concretization is involved, or processes such as involving knowledge, expertise or learning for example are at work. It is also used in a wider sense to mean the act of knowing or knowledge, and may be interpreted in a social or cultural sense to describe the emergent development of knowledge and concepts within a group.
http://www.wordiq.com/definition/Cognition
![]()
David Marr's Four Stages of Vision (1982)
DAVID MARR: (1985) define vision as "the process of discovering from images what is present in the world, and where it is."
"to understand any information-processing system requires us not only learn about the process, but to consider how information is represented."
A THEORY OF VISION
The representation framework for vision
(building a description of the shape and positions of things from images)
| Name of stage | Function | Primitives |
| RETINAL IMAGE |
(light receptors) | Intensity (grey level) at each image point. |
| PRIMAL SKETCH | Explicit 2D information | Blobs, edges,
terminators, boundaries etc |
| 2˝ D SKETCH (viewer-centered) |
Explicit orientation and rough local depth of visible surfaces | Local surface
orientation Depth discontinuities |
| 3 D MODEL
REPRESENTATION (object-centered) |
Modular hierarchical representation in object-centered space | Volumetric primitives |
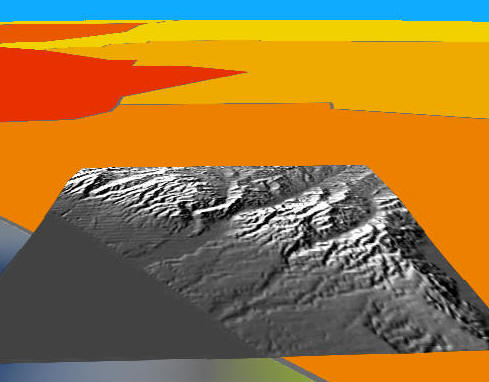
(Visual Processing is hierarchically organized)
![]()
Visual Cognition for Map Symbols
What is perceptual organizers? (Location? patterns? textures? value? orientation?)
Steven Pinker (1984).
| Name of stage | Function |
| Graph | Early visual process. |
| Visual Array | Encoding processes |
| Visual Description | Matching memory |
| Graphic Schema
|
(Conceptual message vs. Conceptual questions) |
Multiple Views Plus Transformations (cited from http://www.cog.brown.edu/~tarr/tea/theory.htm )
Tarr and Pinker (1989) suggested that the visual system represents simple 2D views of objects -- representations that capture what each object looks like from each viewpoint from which it has been encountered -- then employs a transformation process, e.g. mental rotation, to bring novel views into alignment with encoded views. Once recognized, a novel view can then be encoded, so that the next time it is encountered no transformation is necessary. This aspect of Tarr and Pinker's theory accounts for the fact that in most experiments, viewpoint dependency is reduced as participants become more and more familiar with previously novel views of objects. Tarr and Pinker gave their idea the common-sensical name multiple-views-plus-transformations.
Unfortunately, the MVPT approach also has major shortcomings. First of all, it appears to be highly memory-intensive (since tens or even hundreds of views could potentially have to be stored for each known object) and processing-intensive (since thousands of encoded views might have to be compared to each perceived view before a match is found).
Even more vexing is the chicken-and-egg-like question of how the system "knows" which direction to rotate a novel view (and which axis to rotate around) before it knows what the object will look like following the transformation. That is, to know that a clockwise rotation around the Y axis would bring the image into alignment with a particular known view, the system would seem to have to already know what the image will look like following this transformation (thus eliminating the need to do the transformation at all).
(from the Template Evidence Accumulation (TEA) theory of visual object recognition http://www.cog.brown.edu/~tarr/tea/index.htm by Pepper Williams. Brown University)
From a Cartographer's perspective:
Ganter and MacEachren 1989:
Sensory input --> Pattern storage --> Action --> Reasoning-WHY ---> Images + propositions --> conscious mind --> going back to Pattern Storage.
Peterson's human information system model (1987).
Geographic Information --> sensory register --> pattern recognition --> short-term memory --> long-term memory (including proposition and images) ---> retrieved by query system/short-term memory --> knowledge output.
![]()
Visual -- Cognitive Process

Gestalt: is German for “pattern”, “figure”, “shape”, or “form” but not precisely translatable. It is used to refer to wholes, systems and complete structures rather than the reductionist approach of seeking ever smaller components of a phenomenon.
(A physical, biological, psychological, or symbolic configuration or pattern of elements so unified as a whole that its properties cannot be derived from a simple summation of its parts).
http://www.dmu.ac.uk/~jamesa/learning/gestalt.htm
http://www.princeton.edu/~freshman/gestalt/
![]()
Eye Tracking: http://eyelab.msu.edu/eyetracking/
Eye Movement: http://www.med.uwo.ca/physiology/courses/sensesweb/ (lab 10)
Visual Illusion examples: http://humanities.lit.nagoya-u.ac.jp/~illusion/index_e.html
Perceptual organization and attention:
Grouping:
| proximity | |
| similarity | |
| common fate (moving together) | |
| objective set (animation --> try to stable groups during the changes) | |
| good continuation | |
| closure | |
| simplicity | |
| experience or habit (familiar shapes or arrangements form groups)... |
Image source: http://smccd.net/accounts/saterfield/Psyc100_03/15
Introduction to Psychology by James A. McCubbin, PhD Clemson University
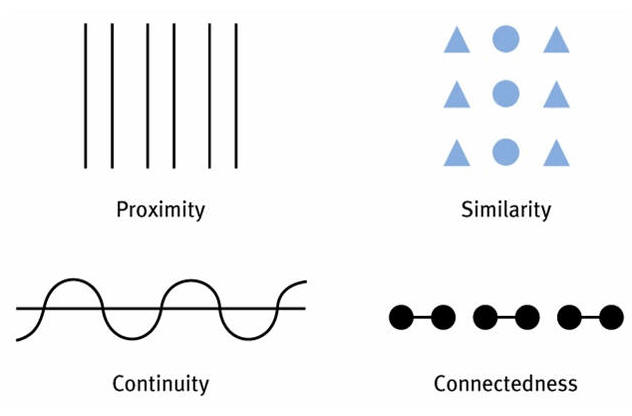
Dr. Sara Fabrikant's explanation:
http://www.csiss.org/streaming_video/csiss/fabrikant_perceptual.htm
What we attend to:
Selective Attention and Separability of Visual Dimensions.
Divided Attention and Variable Conjunctions
Associativity of Graphic Variables
Indispensible Variables
Where we attend:
Location
Scale
The Concept of Figure-Ground

"The combined information concerning perceptual grouping, visual attention, and global - local processing of visual scenes provides a firm base from which to understand the concept of figure-ground. Segregation of figure from ground requires that perception organize the visual input sufficiently for elements of that input to group and attract attention to themselves" (MacEarchren, p. 107, 1995).
The most relevant to establishing symbols and regions as figures on maps:
1. Heterogeneity
2. Contour (the definite edge)
3. Surroundedness
4. Orientation
5. Relative size
6. Convexity
Examples:?
What is the figure and ground in this map?
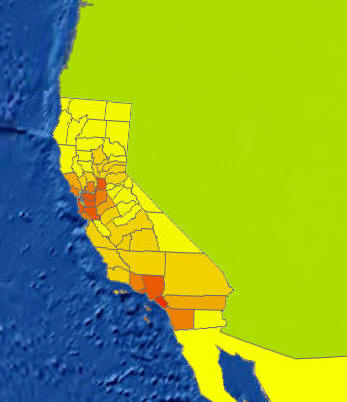
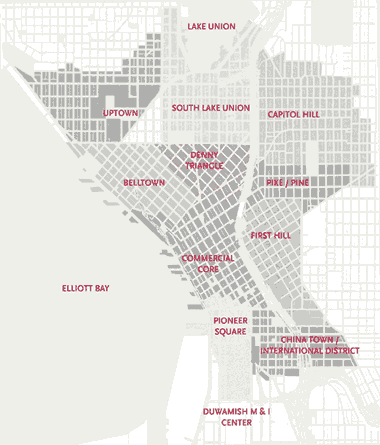 (city of Seattle)
![]()
Session TWO
![]()
Map Animation
Technical approach: http://www.geog.uno.edu/~askupin/classes/GEOG4815/Notes_MapAnimTechAppr.htm
2D animation Examples:
Example 1: USGS Hazard map: http://www.usgs.gov/hazards/haz-areas.html

California first county http://www.ac.wwu.edu/~stephan/Animation/ca.anim.html
(Slide show vs. smooth changes)
http://www.curious-software.com/products/worldmaps/examples.html (Chemical leak)
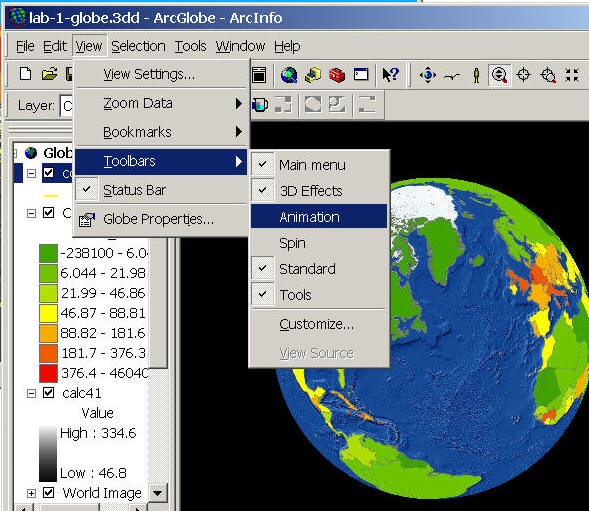
3D animation: (lab-03 example).
![]()
Please use on-line forum to answer the following questions (5 points)
|
Select one map symbol example (do not use the school symbol in the lecture notes) as "representation" of spatial phenomena and discuss the three different levels of representations (lexical level, semiotic level, and social/cognitive level). |
|
Compare the differences between "Personal Geodatabases" and "Shapefiles". What's their advantages and disadvantages ? |
|
What are the differences between "Labels" and "Annotations" in ArcMaps? Which one you prefer? WHY? |
|
What kinds of maps is your animation maps? Thematic? Pragmatic? or Reference? WHY? Discuss what kinds of "art components" can be found in your animation and what kinds of "science components" in your animation. |
![]()
Web-powered by: MAP.SDSU.EDU