GEOG 581: Cartography Design
![]()
![]()
![]()
![]()
![]()
![]()
Cartography Paradigm Changes
![]()
Please read Alan MacEachren's How Maps Work, Chapter 1.
Back to first week: What is Cartography?
Visualization Aspect:
| The visual representation of geographic and spatial information. (Lauren Rizzo). |
Communication:
| A map that conveys meaning, as well as the elements of the layout and methods for dissemination. (Merrilee Willoughby). |
Map Making:
| The process of selecting and arranging map features (symbology, color, etc...) in order to allow a greater understanding on the part of the map reader. (Andy Gordon). |
![]()
The Development History of Cartography
Before WWII
| Artistic View | |
| Emphasis on production efficiency and graphic design. | |
| How beautiful your maps are... | |
| No scientific perspective... |
After WWII
Map Functionality (1952): Arthur H. Robinson's Ph.D. dissertation "The Look of Maps" in 1952.
| "Maps like a building... that are designed primarily for artistic impact, are often not functional. (Some maps can win a Map Design award, but poorly used in real world). | |
| Need a scientific method for the research of cartography | |
| Formulating "objective" rules for map symbolization and map design decision. | |
| Testing effectiveness of map symbols --- followed the positivist model of physical science. | |
| No confusion should result about the meaning of symbols. |
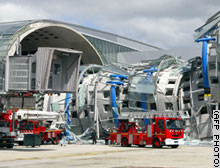
Paris Airport Terminal Collapse
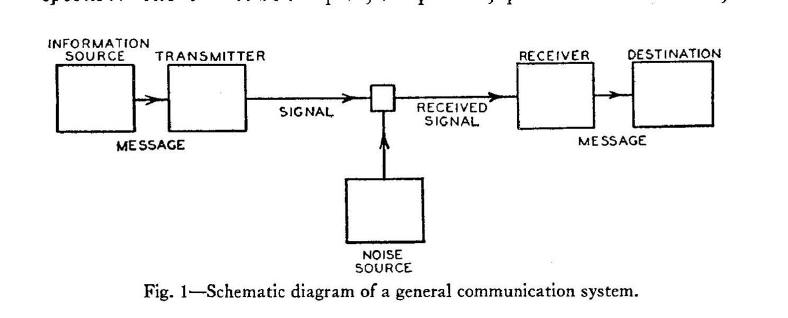
Communication Process: 1970s - 1980s (Communication Paradigm)
| The maps was considered the vehicle for communication. | |
| Cartography as graphic communication process. | |
| Maps have a predefined purpose. The goal of maps is to convey the content to meet the purpose. | |
| The dissemination of spatial knowledge (already exists). | |
| Communication Theory: inhibiting information transmission can result in information loss or communication errors. (Map reading errors) | |
| Maps as a Media (newspaper, TV, WWW pages). | |
| Search for "optimal maps"!!! |
(Source: Dent, Borden D. 1985. Principles of Thematic Map Design. Reading, Mass.: Addison- Wesley Publishing Co., p. 13).
Information Theory (Shannon, C. & Weaver W. (1949): The mathematical theory of communication. (the first paper appeared in Scientific American, July, 1949)
| Quantify the amount of information from information source to receiver, and efficiency of translation processes. | |
| Efficiency- information compression, accuracy (signal-to noise ratio). |
Attacks (problems) !
science view omits many ways people use maps as experimental approach..
positivist approach ignore the important contribution of art.
Maps is not "objective" representation of reality
Do maps have "predetermined" message?
Does a cartographer know the message before making maps?
(Lab 1 and lab 2 exercises?)
Reality Check (from textbook): map do not have a predetermined message. Different map readers may read "different" messages from the same map.
Unpredictable usage of maps (or books)
Behaviorists treated humans as black boxes (stimulus -- response) that respond to stimuli rather than information-processing systems. search for "law" and "optimal" maps.
![]()
Geographic/Cartographic Visualization
(GVIS / CVIS) (DiBiase 1990, MacEachren 1994)
From MacEachren's book How Maps work p. 12)
The map is .... not as a communication vehicle, but as one of many potential representations of phenomena in space that a user may draw upon as a source of information or an aid to decision making and behavior in space.
| Visualization: The use of graphics to facilitate thinking, problem solving, and decision making; | |
| The domains of GVIS: data exploration, visual thinking, revealing unknown spatial patterns. | |
| focus on "information-processing device (human), human spatial cognition, man-map interaction. |
(Source: Alan MacEachren, "Visualization in Modern Cartography: Setting the Agenda," in A.M MacEachren and D. R. F. Taylor (eds.). Visualization in Modern Cartography. Oxford, England: Elsevier, 1994. p. 6.)
"Representation"
Lexical sense: the level of meaning in its broadest sense.
Semiotic sense: functional level, symbolic function.
Social level? Cognitive level?
![]()
The following definition of visualization by Buttenfield and Mackaness (1991, p.432):
Definition: Visualization is the process of representing information synoptically for the purpose of recognizing, communicating and interpreting pattern and structure. Its domain encompasses the computational, cognitive and mechanical aspects of generating, organizing, manipulating and comprehending such representations. Representations may be rendered symbolically, graphically, or iconically and are most often differentiated from other forms of expression (textual, verbal, or formulaic) by virtue of their synoptic format and with qualities traditionally described by the term 'Gestalt'. (Buttenfield and Mackaness, 1991, p.432)
MacEachren (page 355, How maps work, 1995).
Visualization is a term with many meanings. In the most general sense of "to make visible".... visualization can also refer to making visible in the sense of mental image. ... Geographic Visualization (GVIS), like "map", is probably best viewed as a fuzzy (probably radial) category. ...
What are the differences between Buttenfield's definition and MacEachren's definition?
![]()
Art vs. Science
Two views:
| Maps are objects that contain varied amounts of scientific or artistic content. (More science? or More art?) (Robinson vs. Keates) | |
| Maps have complementary artistic and scientific approaches... both can be applied to any given cartographic problem. (MacEachren) --- artistic approach: critical examination. scientific approach: systematically examining each individual part of the process. |
![]()
Session TWO
![]()
ArcGIS Extension
Optional extensions for ArcGIS Desktop products allows you to perform extended tasks such as raster geoprocessing and three-dimensional analysis. Most extensions can be used by each product—ArcView, ArcEditor, and ArcInfo. Exceptions are noted below.
| Tablet PC Support for ArcGIS (included with ArcGIS 9) | |
| ArcMap GPS Support (included with ArcGIS 9) | |
| Districting for ArcGIS * | |
| OGC Interoperability for ArcGIS (ArcGIS 8.3 only) |
![]()
ArcGIS 3D Analyst
|
KEY features: http://www.esri.com/software/arcgis/extensions/3danalyst/about/features.html | |
|
Show the Demo animation movies. | |
|
|
Maplex
|
http://www.esri.com/software/arcgis/extensions/maplex/index.html | |
|
KEY features: http://www.esri.com/software/arcgis/extensions/maplex/about/features.html |
PLTS (Production Line Tool Set) (PLTS)
|
http://www.esri.com/software/arcgis/extensions/plts/index.html | |
|
Components: http://www.esri.com/software/arcgis/extensions/plts/components/overview.html |
![]()
DISCUSSION
LAB-02 Questions:
|
Explain the color scheme used in ESRI for the slope and aspect. Highlights their advantages and disadvantages. If possible, you can try to change the color scheme and save the ArcMAP (lab-02-a.mxd) into your own folder. Then explain your new choices of color scheme for slope or aspect. | |
|
Compare the differences between the Swiss Methods, the neighborhood methods, and the MDOW methods. (try to use the Web search engine to get more MDOW info. What's the major characteristics of each one? Which one you prefer and WHY? | |
|
Find out more information about "Model Builder" from ArcGIS help or Webs. Give a brief description about its major functions. Explain the advantage and disadvantage of Model Builder. |
![]()
Web-powered by: MAP.SDSU.EDU