GEOG 581: Cartography Design
![]()
![]()
![]()
![]()
![]()
![]()
Session ONE:
Representation: The First Perspective of Maps
![]()
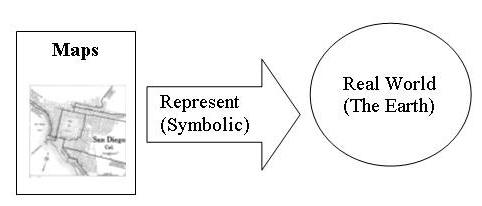
"Representation" Perspective
The earliest and intuitive goal of maps is to "represent" our world.
Oldest Map Marked "America"
http://news.nationalgeographic.com/news/2003/06/0619_030619_americamap.html
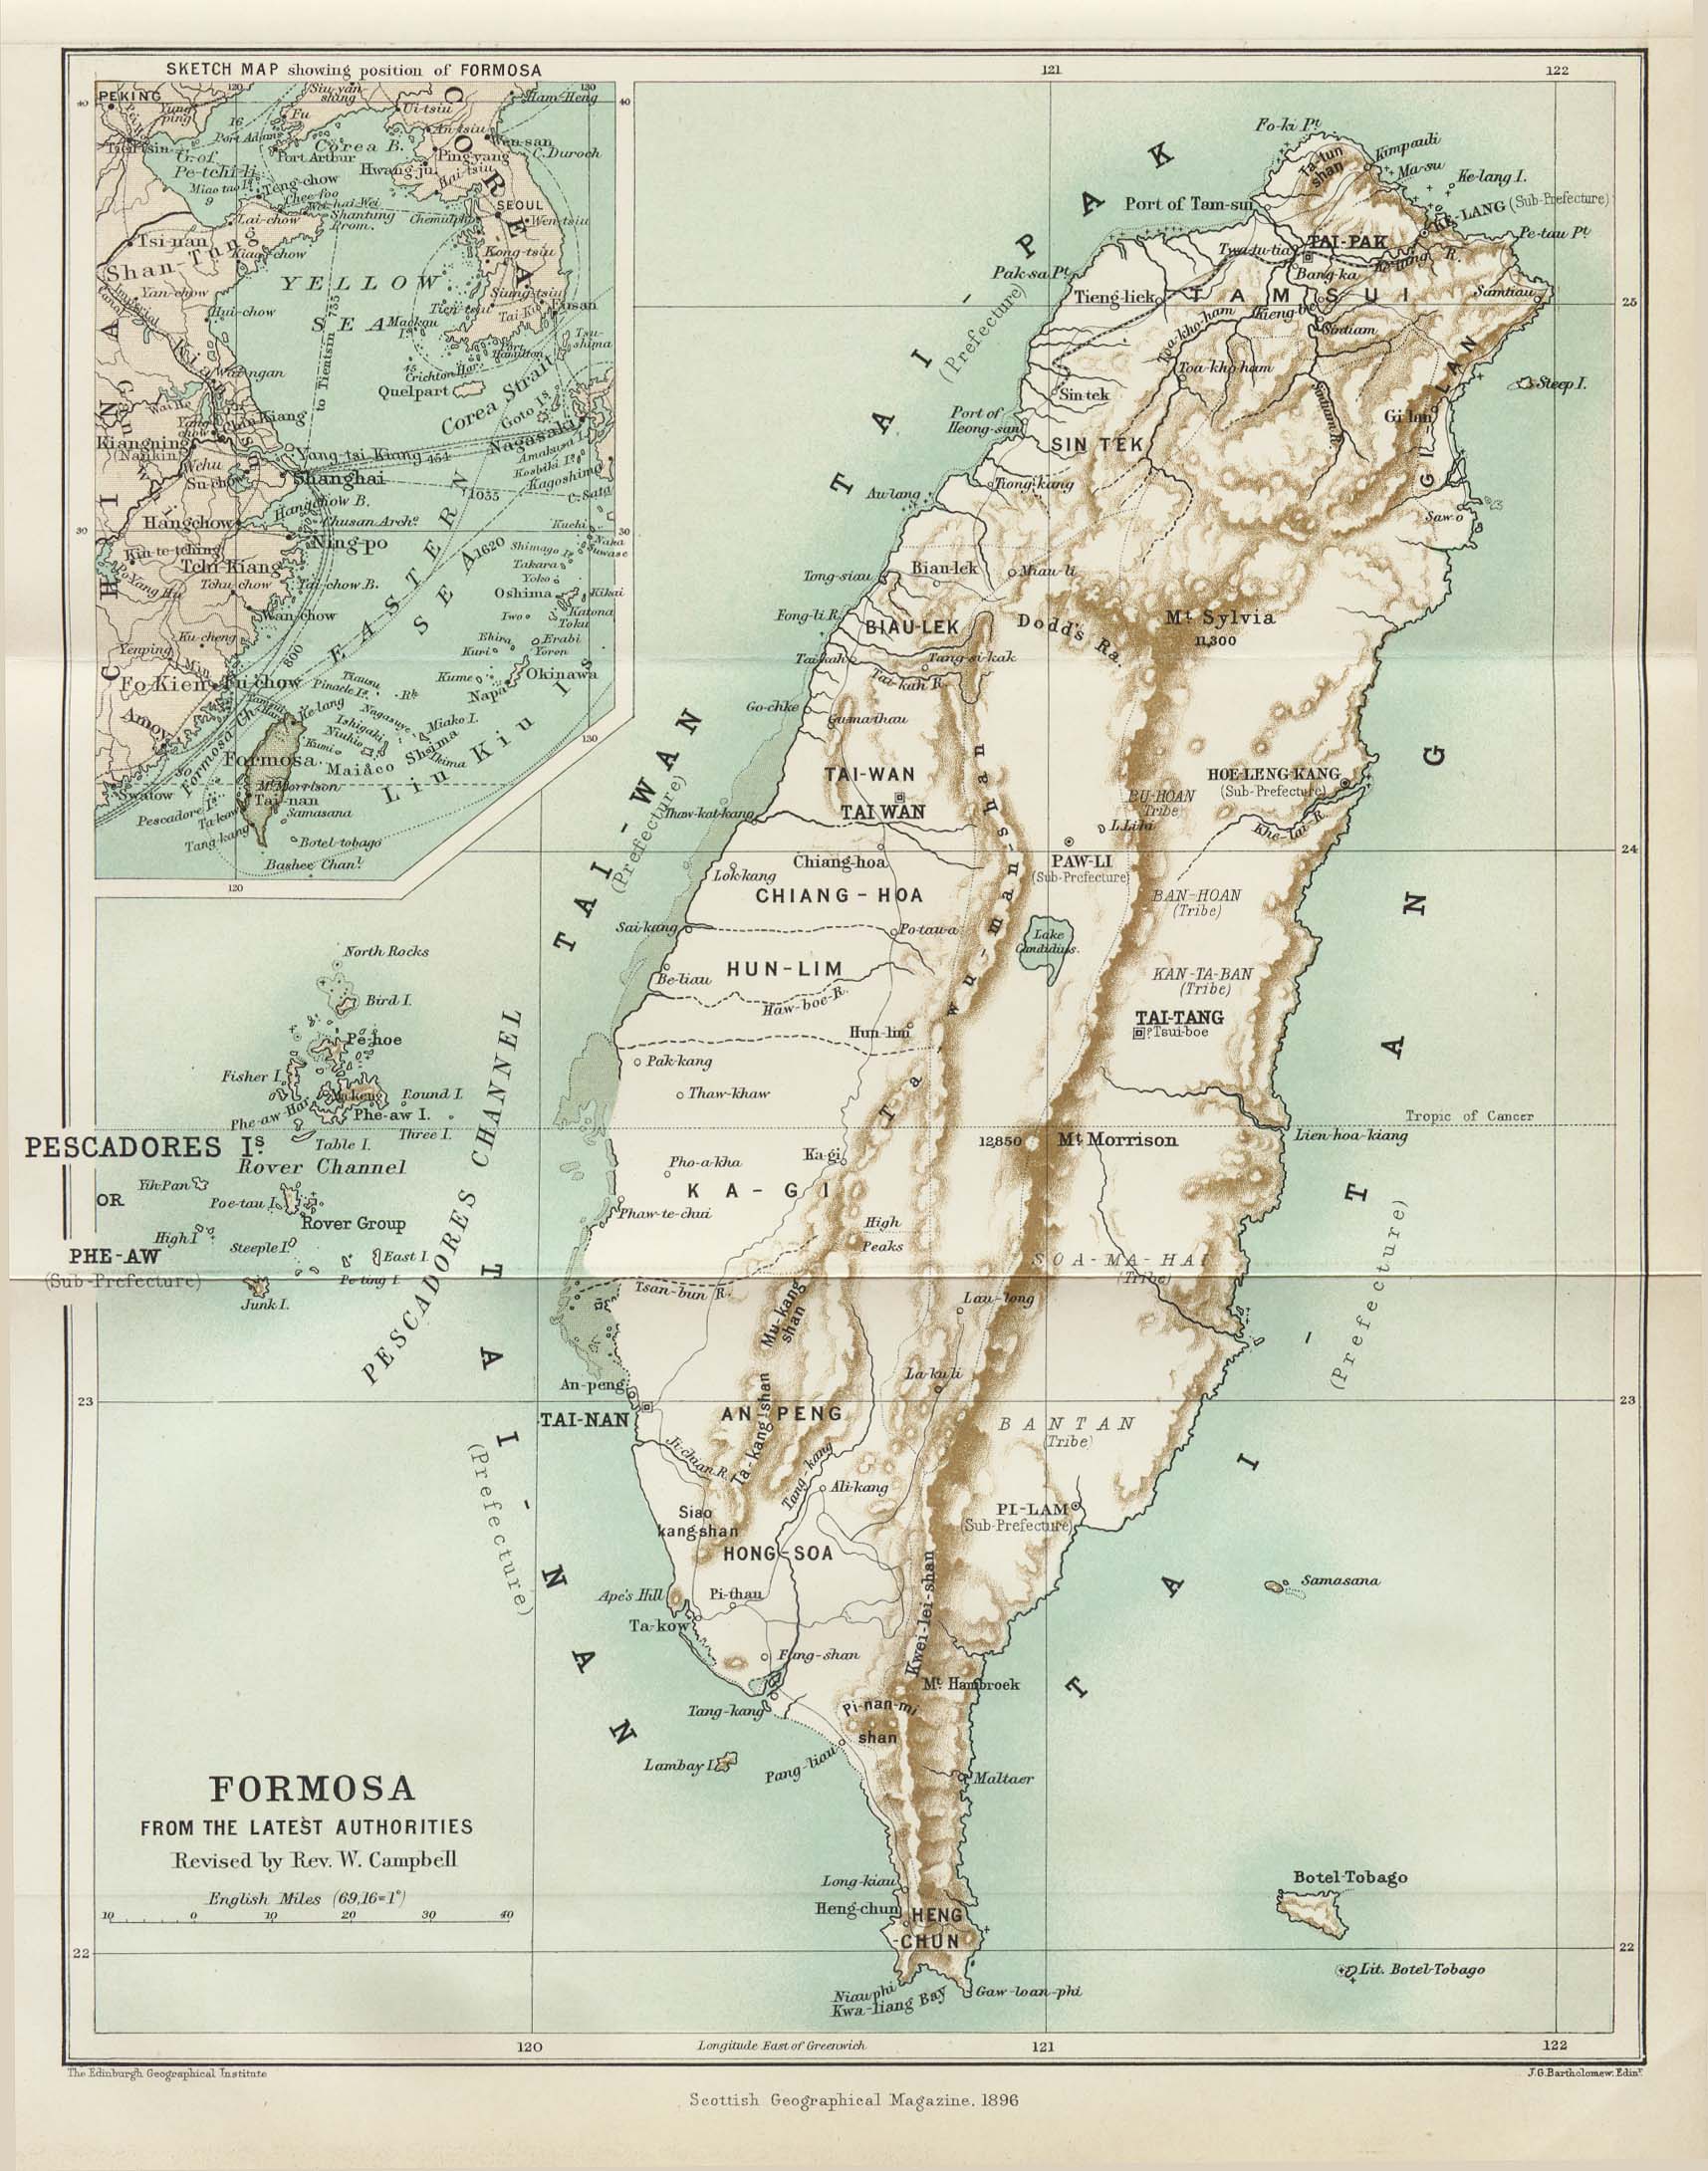
1896 Map of Taiwan (Formosa) (From the Scottish Geographical Magazine. Published by the Royal Scottish Geographical Society and edited by James Geikie and W.A. Taylor. Volume XII, 1896.)
Data/Image Source: http://www.chinapage.com/map/ancient/taiwan1896.html
San Diego Maps (1850)
from
The Journal of San
Diego History Spring/Summer 2000, Volume 46, Number 2-3
The Pantoja Map of 1782 and the Port of San Diego: Some Answers Regarding the
International Boundary in the San Diego-Tijuana Region by
Jorge A. Vargas
http://www.sandiegohistory.org/journal/2000-2/pantojaphotos.htm
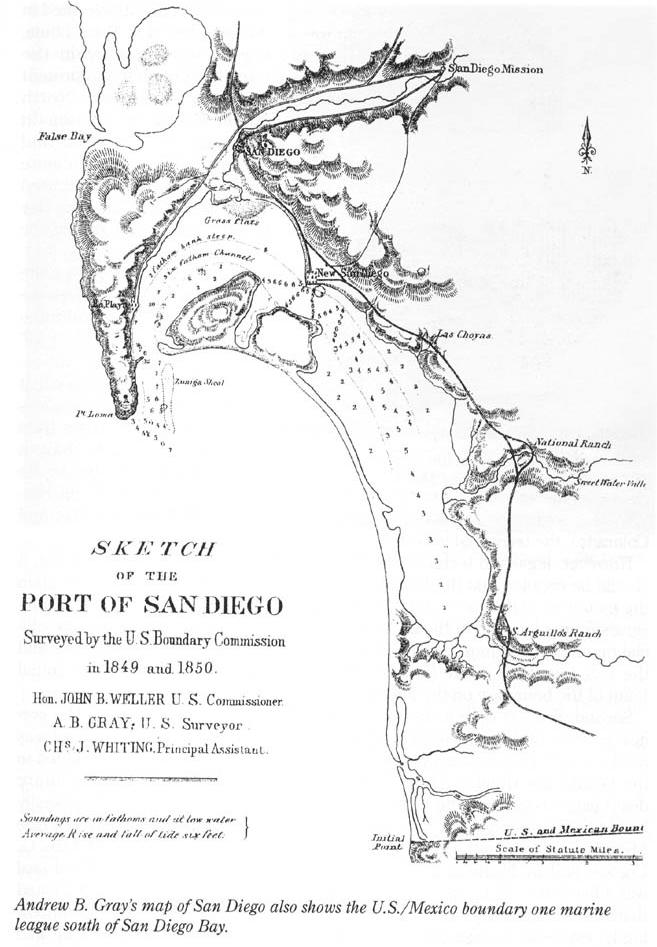
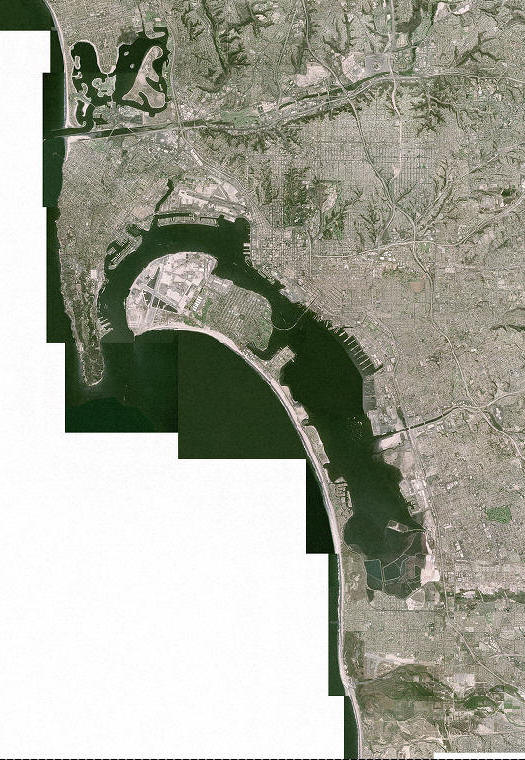
San Diego Historical Map compare to the 2002 Aerial Photos (San Diego).
![]()
Representation:
Step 1: Level of Measurement:
(Nick Christman (1998) Rethinking Level of Measurement for Cartography).
In the classical view, measurement discovered the numerical ratio between a standard object and the one measured.
What time is it? The official U.S. Time: http://www.boulder.nist.gov/timefreq/ (A standard object -- Time Clock)
In the new "representational" school: "Measurement is ... a unique and reciprocal correspondence is established between all or some of the magnitudes of a kind and all or some of the numbers, integral, rational, or real ...
(Measurement should not only focus on "numbers"... The needs from Social Science: example: How to measure the "happiness" ? )
Stanley S. Stevens' paper in Science (1946) on the subject of measurement played a formative role in a large movement towards a quantitative methodology in the social science.
| Scale | Basic Empirical Operations | Mathematical Group Structure | permissible Statistics (invariantive) |
| Nominal | Determination of equality | x' = f(x) (one-to-one) | Mode |
| Ordinal | Determination of greater or less | x' = f(x) (monotonic increasing) | Median |
| Interval | Determination of equality of intervals or differences | x' = ax + b | Mean |
| Ratio | Determination of equality of ratios | x' = ax | Coefficient of variation |
Nominal: grouping or categorization. (no ordering, each group is equally important)
| Gender: Male / Female | |
| Landuse: Agriculture / Residential / Industry Zone / Business Areas | |
| Currency Type: US Dollar vs. Euro Dollar (?) | |
| MODE: The biggest group in the category. (Best selling CD album). |
Ordinal: ordering (ranking) (high, medium, low)
| Interstate Highway, City roads, Trails | |
| Homeland security status: RED, Orange, Yello, Guarded, Low. |

Interval: an ordering of the data plus an explicit indication of the numerical differences between two categories (Slocum textbook).
| Arbitrary zero point (ratio of two interval values cannot be interpreted correctly): SAT score 800 vs. 200. (4 times better than?) | |
| Elevation (changing "arbitrary zero" with the change of sea level). | |
| Fahrenheit temperature (F) |
Ratio: similar to interval, but also has a absolute zero (null).
| Bank account balance: Zero --> null | |
| Population | |
| Kelvin scale temperature. |
Other Aspects:
| Qualitative data (nominal) | |
| Quantitative data (ordinal, interval, and ratio). |
Extension of four measurement level (Christman, 1998).
| Nominal | |
| Graded membership | |
| Ordinal | |
| Interval | |
| Log-interval | |
| Extensive ratio | |
| Cyclic ratio | |
| Derived ratio | |
| Counts (population) | |
| Absolute (probability) |
What categories for Different countries' currency? US Dollar vs. Euro Dollar vs. New Peso
(Same measurement, different aspects: currency exchanges, economic index, functionalities..)
Other extensions:
Biopolar data (a natural dividing point can be sued to divide the data into two parts: Population change in San Diego --> positive or negative percent changes?) Balanced data, Unipolar data.
San Diego County Census Quick Fact (U.S. Census
Burea):
http://quickfacts.census.gov/qfd/states/06/06073.html
Level of measurement can be changed by using generalization or classification. ( Midterm exam grading --> numbers --> higher than 60: PASS, lower than 60: Fail) or A, B, C, D gradings.
![]()
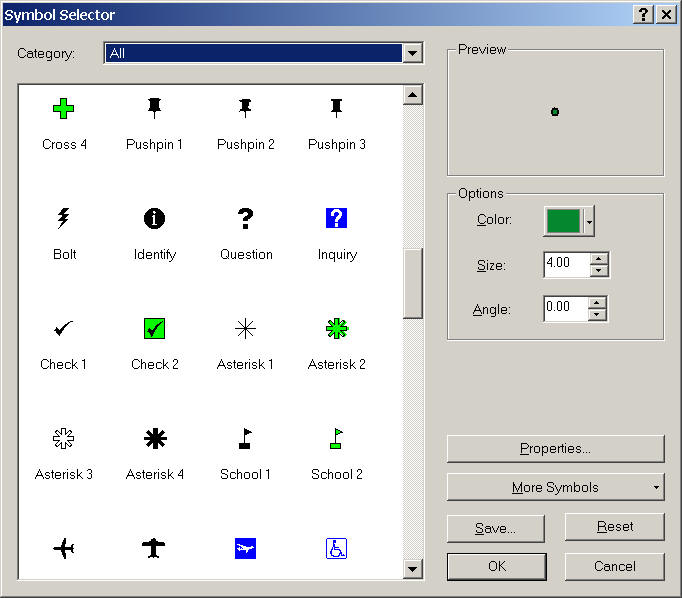
Step 2: Choose Symbols to represent the measurement results
Spatial Dimension
|
Discrete vs. Continuous phenomena (People (Population) vs. Temperature) | |
|
(0D, 1D, 2D, 2.5D, 3D, 4D): |
Points symbols (zero-dimensional): with X, Y, Z coordinate
|
Locations of points, (Dot maps) | |
|
Iconic representation, | |
|
Size of point symbols (proportional symbol map) |
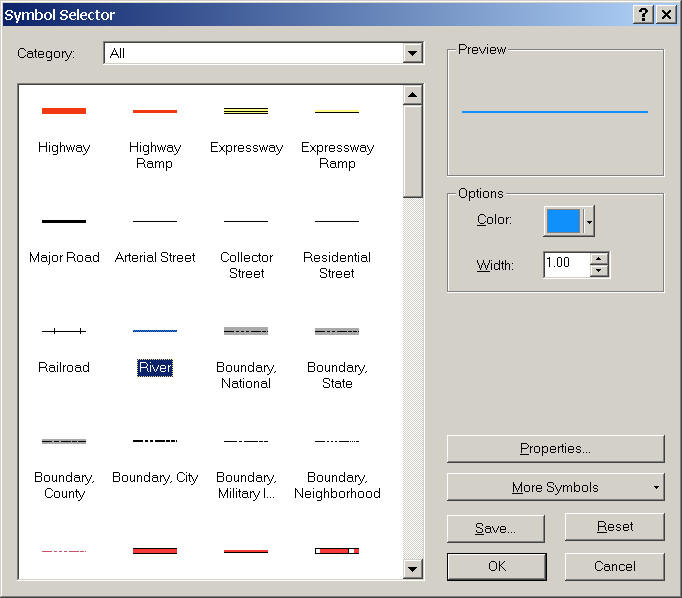
Linear symbols (one-dimensional): (lines, paths)
|
Linear phenomena (having length, but no width?? ) | |
|
Location: from x1, y1, z1, to x2, y2, z2, to x3, y3, z3, .... | |
|
nominal lines? | |
|
ordinal lines? | |
|
Interval lines? (contour line?) | |
|
ratio lines? (snow falls? precipitation?) | |
|
Isarithmic Maps (Iso-line maps: contour lines, temperature maps, etc.) Use linear symbols to represent 2D or 3D phenomena) |
San Diego Temperature Map http://dvl.sdsc.edu/projects/flysd/ (from UCSD)
Areal Symbols: (2 Dimensional):
|
Examples: Lakes, Regions, States, | |
|
Choropleth Maps (Population density) | |
|
Cartogram (Value by Area) |
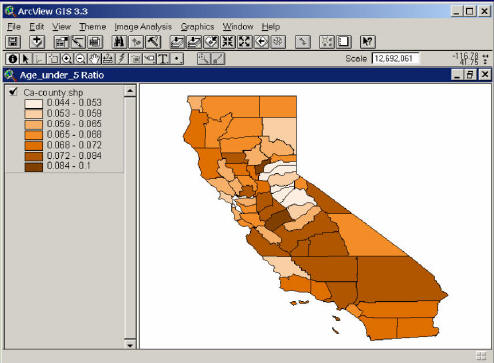
Choropleth Mapping:
The need for data standardization (normalization), in which raw totals are adjusted for differing sizes of enumeration units. (Administration units, like state or county boundary)
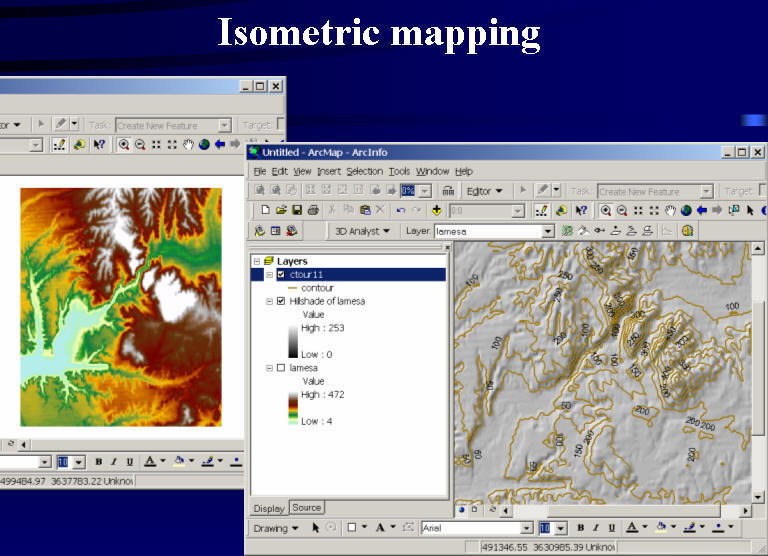
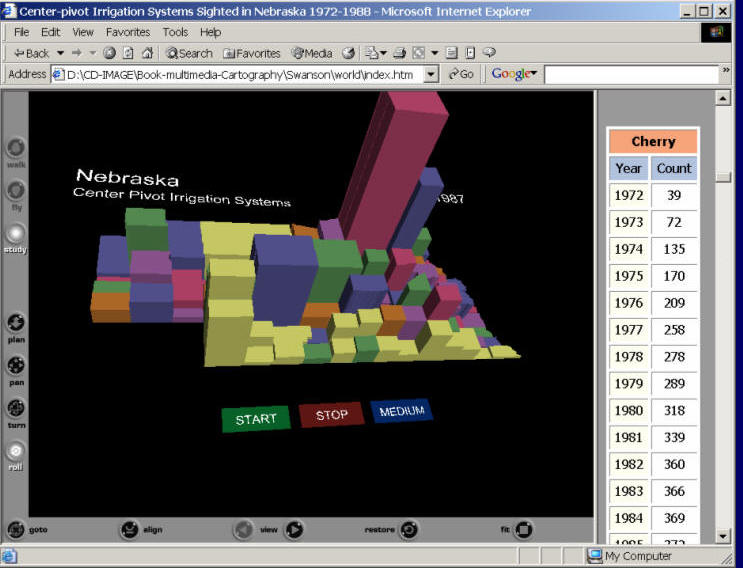
2 1/2 D Symbols (2.5 dimensional, Volume):
|
2 1/2 -D: a surface in which geographic location is defined by x and y coordinate pairs and the value of the phenomenon is the height above a zero point. | |
|
lack of true Z coordinate (replaced by the attribute values) |
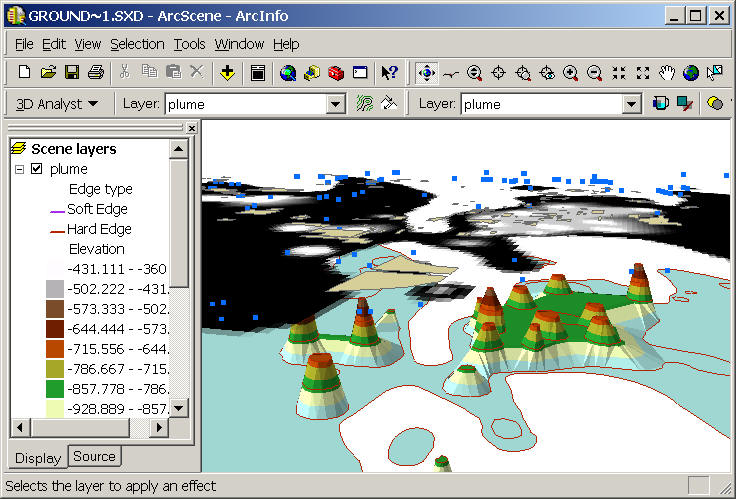
TRUE 3D symbols and objects (Three-dimensional):
|
Any point on the surface is specified by four variables (X, Y, Z, and the values). | |
|
3D maps (usually mixed up with 2 1/2 maps) | |
|
Underground water quality | |
|
CO2 level in the atmosphere. |
4D? (Temporal dimensional)
Animation (San Diego Wildfire animation) http://map.sdsu.edu
5D? 6D? 7D? (Other dimension ?)
![]()
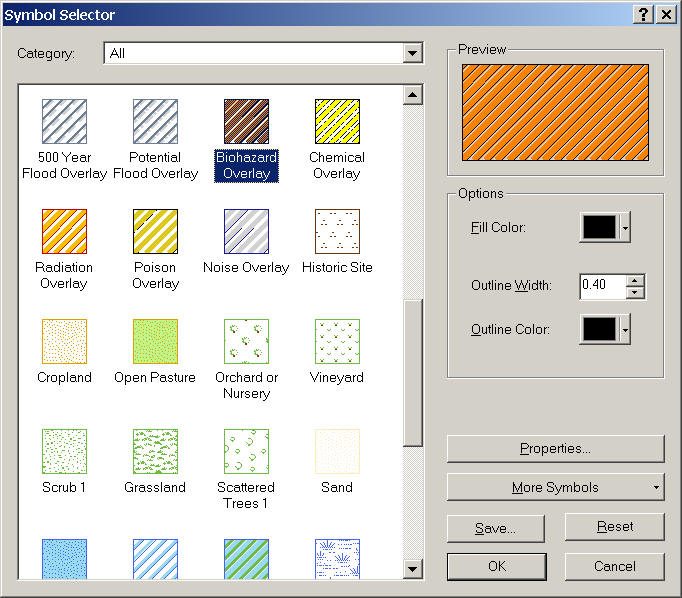
Visual Variables:
The various perceived differences in map symbols that are used to represent geographic phenomena.
|
Spacing | |
|
Size | |
|
Perspective Height | |
|
Orientation | |
|
Shape | |
|
Arrangement | |
|
Hue, Lightness, and Saturation | |
|
Other ? (Texture?) |
Sound Variables? utilize sound to communicate spatial information (computer error message).
Symbol vs. Mark (Mark: making up the symbol).
See page 72 (Figure 4.11) in your text book.
Can you draw a symbol using different visual variables?
![]()
Analytical Cartography (Slocum, chapter 2, page. 30).
Analytical Cartography was first defined by Dr. Waldo Tobler (1976) as the mathematical and analytical approaches for cartographic research. Kimerling in 1989 gave a more precise definition of analytical cartography as “the mathematical concepts and methods underlying cartography, and their application in map production and the solution of geographic problems” (page 697).
The topics of analytical cartography include cartographic data models, digital data collection methods, data standards, coordinate transformations, map projections, data interpolation, analytical generations, etc. (Slocum, et. al., 2004). The recent development of analytical cartographic research has been energized with new tools and media, including multimedia, visualization software, web-based mapping tools, etc.
|
Other title? Statistical Cartography / Computer Cartography | |
|
Analytical and Computer Cartography (book by Dr. Keith C. Clarke, 1990). |
Twenty-eight years ago, Dr. Tobler wrote the following statements in the American Cartographer Journal: “the spirit of Analytical Cartography is to try to capture this theory, in anticipation of the many technological innovations which can be expected in the future; wrist watch latitude / longitude indicators, for example, and pocket calculators with maps displayed by colored light emitting diodes, do not seem impossible. In a university environment one should not spend too much time in describing how things are being done today.” (Tobler, 1976, page 29). Today, the development of mobile GIS and Internet GIS has provided very similar technological innovations to those described in Tobler’s article.
Emerging Analytical Cartography Research Themes:
|
Scientific research on data model, data structure, map elements, | |
|
raster-based data vs. vector-based data problem (similar to the physics during the 19th century. the particle and wave theories of lights were special cases of the general theory of relativity) What is the "general theory for Geographic data model"? (cited from UCGIS whitepaper by H. Moellering, etc. 2000). |
![]()
Session TWO
![]()
Week One Question:
|
What are the differences between C. A. C. and Geographic Information Systems? |
The same parts:
|
C.A.C. and GIS use computers | |
|
Focus on the process of geographic information | |
|
? | |
|
? |
The differences:
|
CAC focus on Maps presentation and GIS focus on spatial analysis | |
|
GIS requires other components, data captures/input, data process, data retrieval, data storage, | |
| GIS focus more broad issues, such as database management (relational or object-oriented DBMS), (GPS conversion and tracking..) | |
| ? |
Challenge: Can C.A.C. be used for spatial analysis ? Map Visualization purpose?
Can C.A.C. has its own computing systems (input, output, storage?)
![]()
Introduction to ArcGIS software package:
ESRI: www.esri.com
Desktop GIS software:
ArcView 3.2, 3.3 (earliest desktop GIS package, the most popular one, limited GIS analysis functions, inexpensive)

ARC/INFO workstation: (legacy professional GIS package, command line mode)
ArcGIS 9 Framework: Scalable, professional GIS packages
Version: ArcGIS 8.3 --> ArcGIS 9.
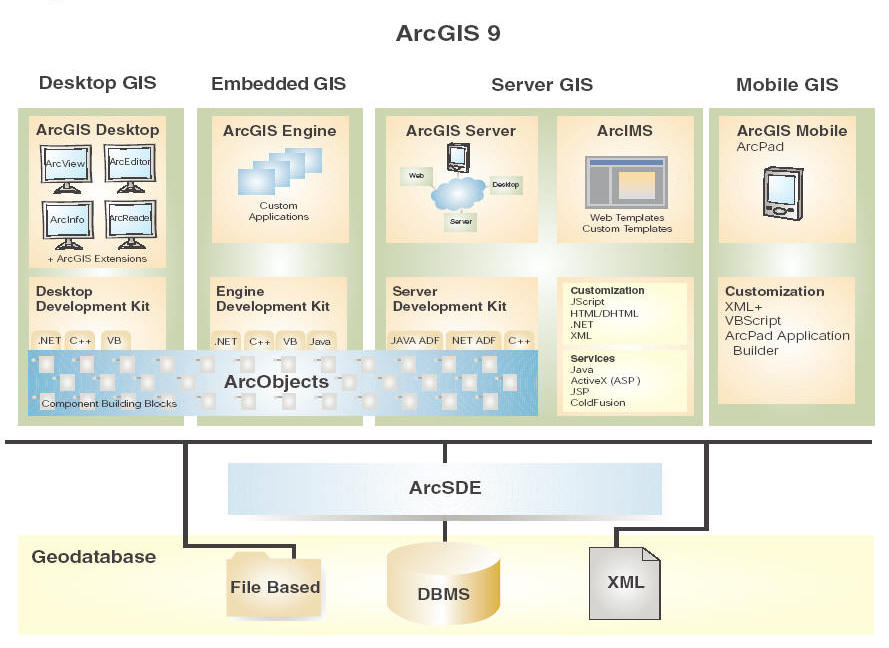
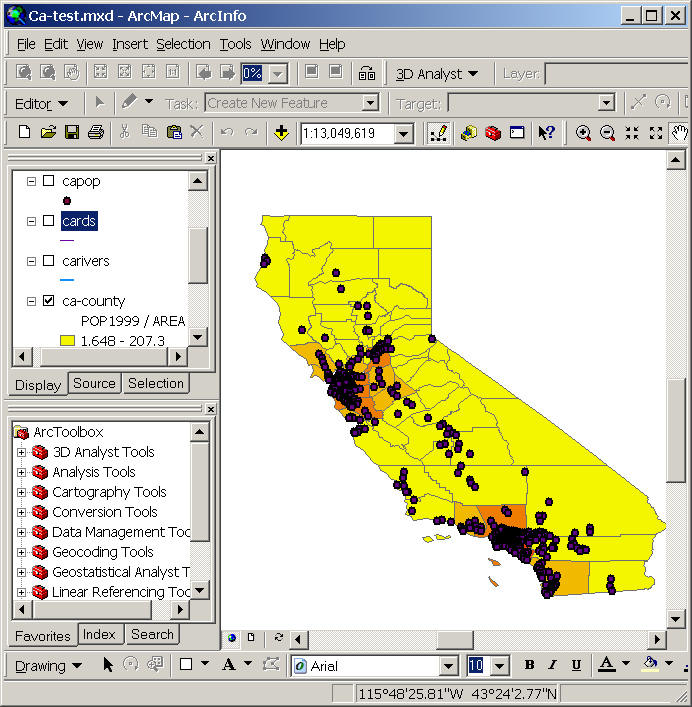
ArcGIS 9 Desktop: (Professional, powerful GIS packages, expensive).
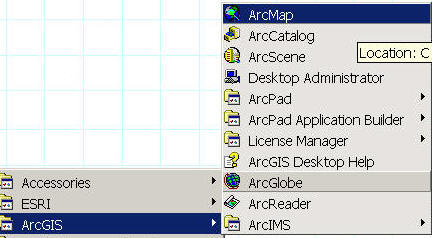
| ArcMap | |
| ArcCatalog | |
| ArcToolbox | |
| ArcScene | |
| ArcGlobe | |
| ArcReader | |
| http://www.esri.com/software/arcgis/about/desktop.html |
![]()
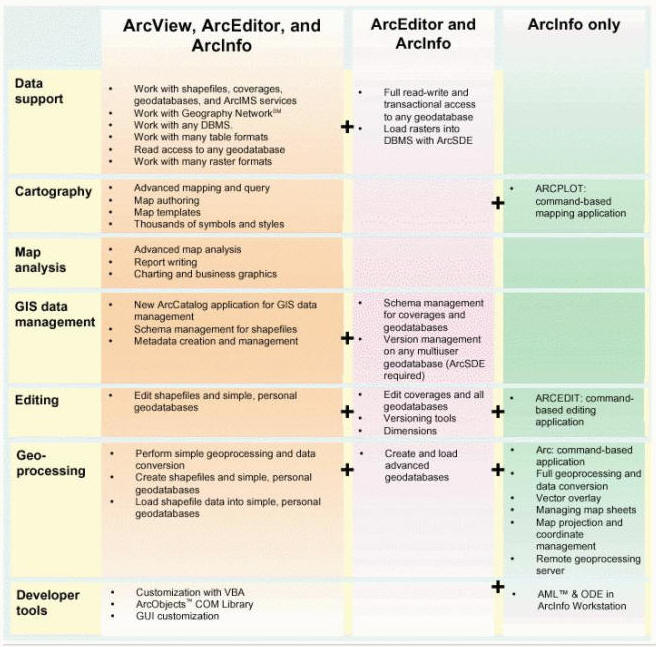
Licensing (different prices for different levels of functions: ArcView, ArcEditor, ArcInfo)
(Expensive, scalable functions for different levels of users -- ArcView, ArcEditor, ArcInfo)
![]()
Web-powered by: MAP.SDSU.EDU