GEOG 581: Cartography Design
![]()
![]()
![]()
![]()
![]()
![]()
Topography
![]()
LAB-2, created by Dr. Tsou, 9-16-2004. 10 points
Many thanks to Dr. Ailleen Buckley from ESRI. for her generous help in providing the materials and tools for this lab exercises.
The first thing is to create a "lab-02" folder in your home directory on geog581 (Z:) drive.
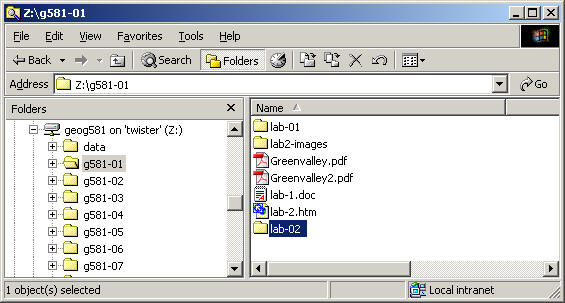
Then copy the Z:\data\hillshade folder into your "lab-02: folder.
![]()
Download the DEM Data
![]()
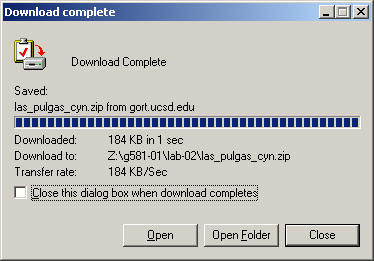
1. The second step for today's lab exercise is to download a 7.5 minute USGS DEM in San Diego County from the a DEM Data Archive page at UC-San Diego.
2. Right Click the following link and select [Open in New Window] to open the Web Site:
3. Pick up one area you are interested and download the zipped DEM file into your "lab-02" folder.
Note: If the UCSD Web site is not available, please use the zip files stored in Z:\data\USGS-dem folder. Then continue this lab exercise.
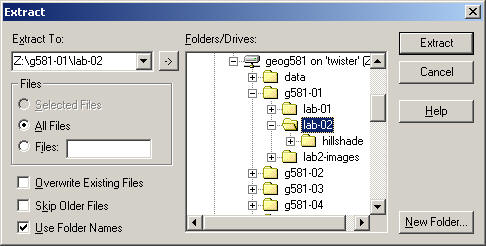
Double click on the compressed file and use the [WinZip] (classic) to extract the compressed DEM file into your "lab-3" folder. (Click on "Agree") --> select [WinZip Classic] button, --> click on [Extract] button to open the following window. Change the "Extract To:" as Z:\g581-## (your folder)\lab-02. Then click on [Extract] button.
Close the WinZip window (OK. for the close).
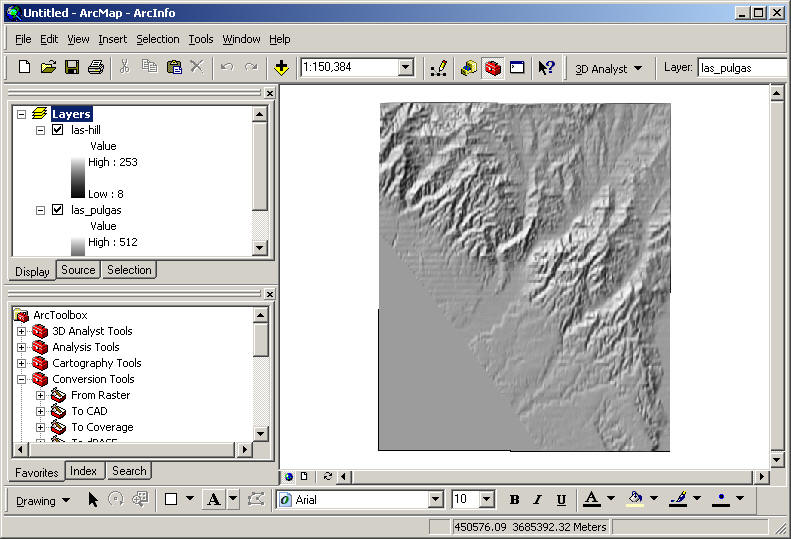
The next step is to use the ArcToolBox (from ArcMAP) to convert the DEM to a ARC/INFO GRID format.
Launch the ArcMAP from the Start MENU. Select as "A new empty map", Click on the ArcToolbox icon (RED BOX) to open the toolbox.
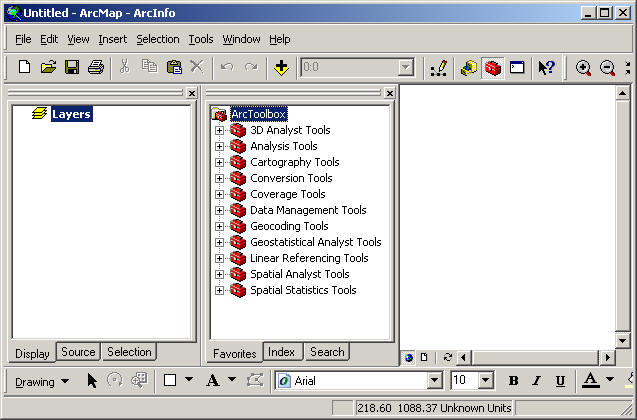
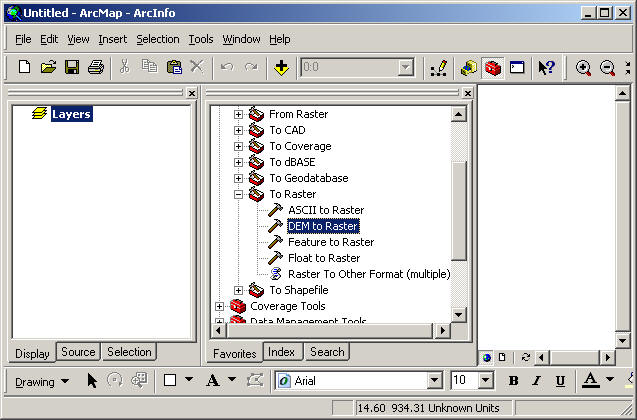
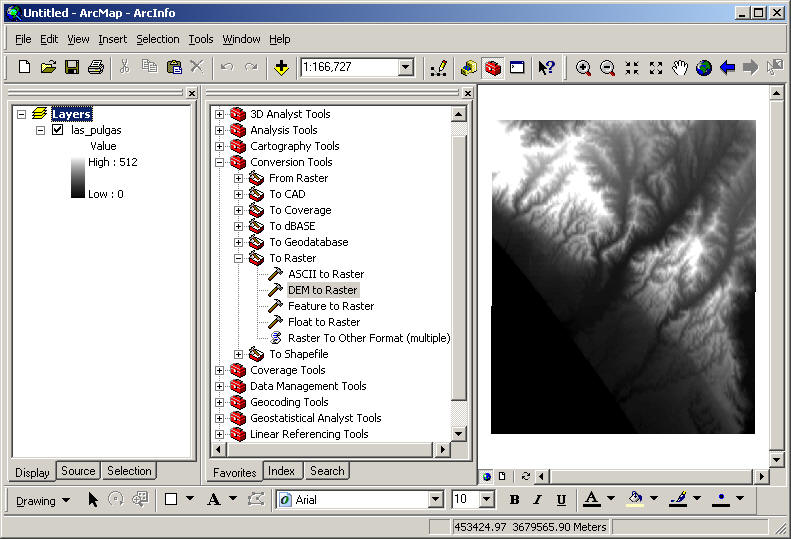
Select the "Conversion tools" from the ArcToolbox. Then select "To Raster" -- "DEM to Raster". Double click on the icon (DEM to Grid) to open the tool.
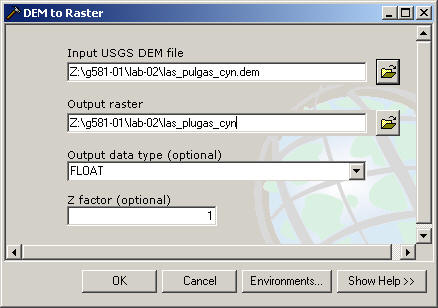
10. After you open the tool, click on the Open file icon (upper one) to navigate to your DEM file "Z:\g581-##\lab-02\areanames.dem" and type in "Z:\g581-##\lab-02\the-same-areaname" as your output raster file (GRID). Then press [OK] to convert the DEM.
After one minutes, the task is completed, then press [Close)
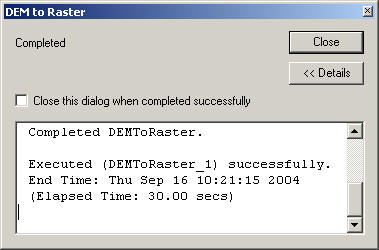
(If you got some error messages, you need to re-do the Download/Uncompress procedures 4-7.)
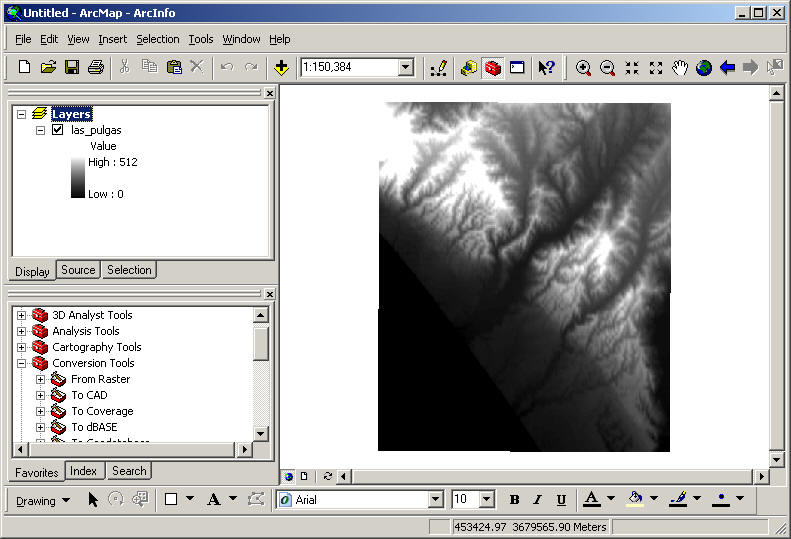
After the conversion, the ArcMAP is displaying your new DEM data.
To get a bigger view, you can rearrange the toolbox layout by moving around the toolbox. Click and HOLD the top window of toolbox (two gray lines), , the move the window to the bottom of Legend (table of contents).
(In ArcGIS, all icons, toolboxes, and windows can be re-arranged freely).
The next step is to open the 3D analysis extension tools in ArcMAP.
Select [View] menu, --> Toolbars --> 3D analyst. A new toolbar will show up.

You can re-arrange it to the ArcMAP window. However. this 3D tool bar has not been activated yet. (gray color). To activate, select [Tools] menu from ArcMap, --> [Extensions....]
Check the 3D Analyst and Spatial Analyst. We will use this two extension for today's exercises.
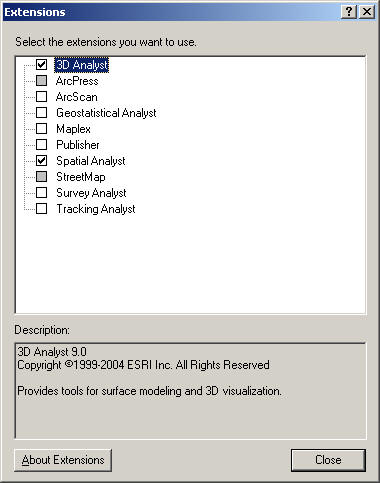
Click on [Close] button to close the window. Now you can see the 3D toolbar is working now.
Select the [3D Analyst] icon --> Surface Analysis --> Hillshade
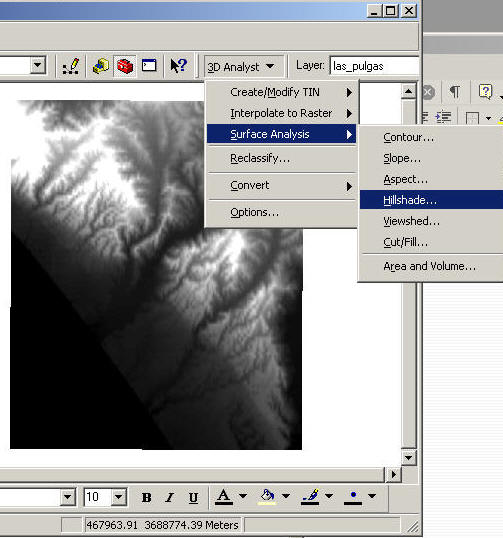
The Hillshade window will open. Change the output raster filed to Z:\yourfolder\lab-02\###-hill (Try to use the first three letters from your DEM name, then add "-hall" to complete the name (The name can not exceed13 characters).

Press [OK] to create the Hillshade raster file. You will see the new Hillshade on the top layer of your ArcMap.
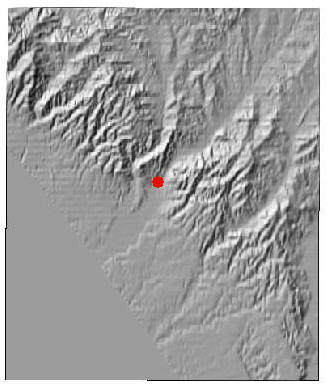
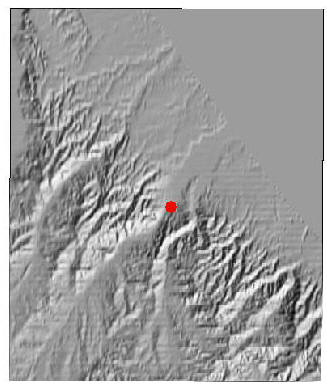
The problem of this Hillshade is that it doesn't tell you the elevation differences clearly and the change of direction view may cause some problem.
For example, let's see the following picture: (Does the RED dot is in "Mountain" or Valley?
To solve this problem, there are many advanced techniques for Hillshades. We will try two of them:
|
The Neighborhood Statistics | |
|
The Swiss Method |
Before we do that, please try to use other 3D tools, like
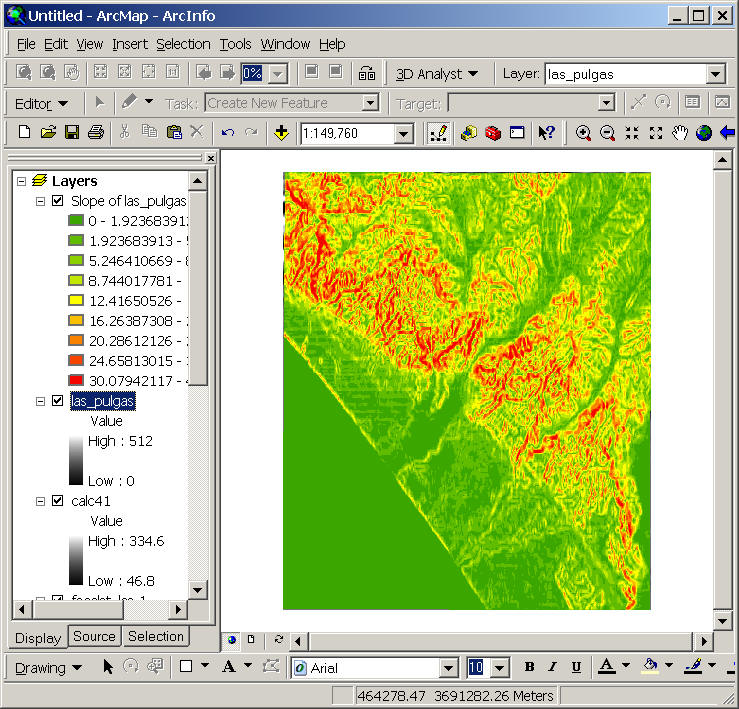
SLOPE (when you choose slope or aspect function from the 3D Analyst, make sure the Input layers is your original DEM GRID, not the hillshade or other raster data.)
Aspect:
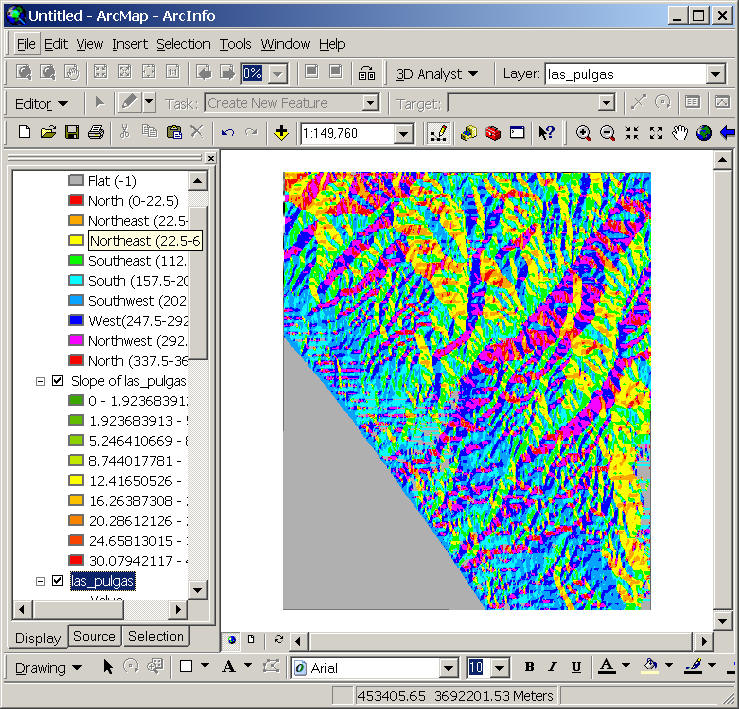
Now think about the use of color in the Slope and Aspect. WHY? What's the advantage of the color scheme in these examples? Try to give a short explanation in your final lab on-line discussion.
Now "uncheck" the display of the SLOP and ASPECT layers (please still keep them in the map. You will need to modify them in your lab questions. ),
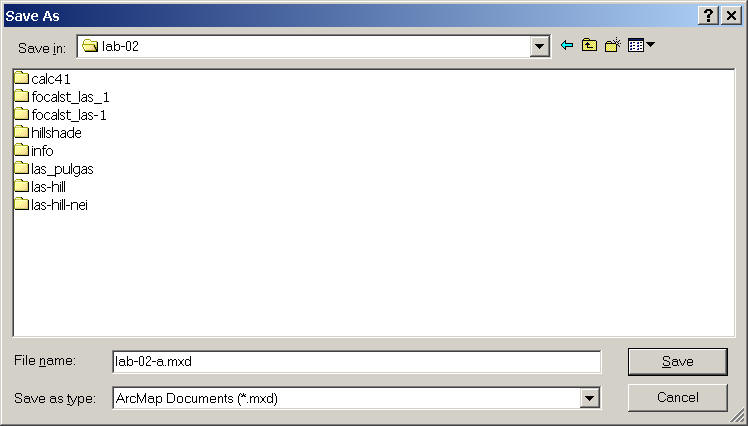
Save your map project into lab-02-a.mxd. Then continue the next task.
![]()
Neighborhood Statistics Method
The first one is the Neighborhood Statistics.
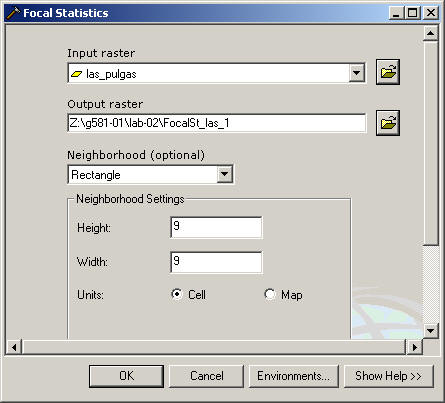
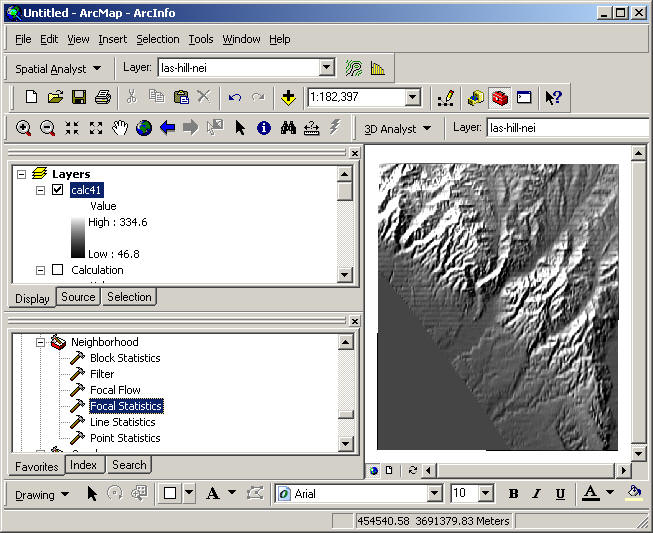
In the ArcToolbox, select [Spatial Analyst Tool] --> [Neighborhood] --> [Focal Statistic]
Use the original DEM as the Input raster, use their defaultname as output. Change the Setting to Height: 9, Width: 9. Then press [OK].
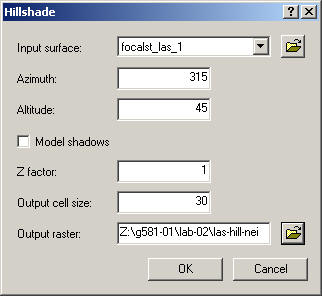
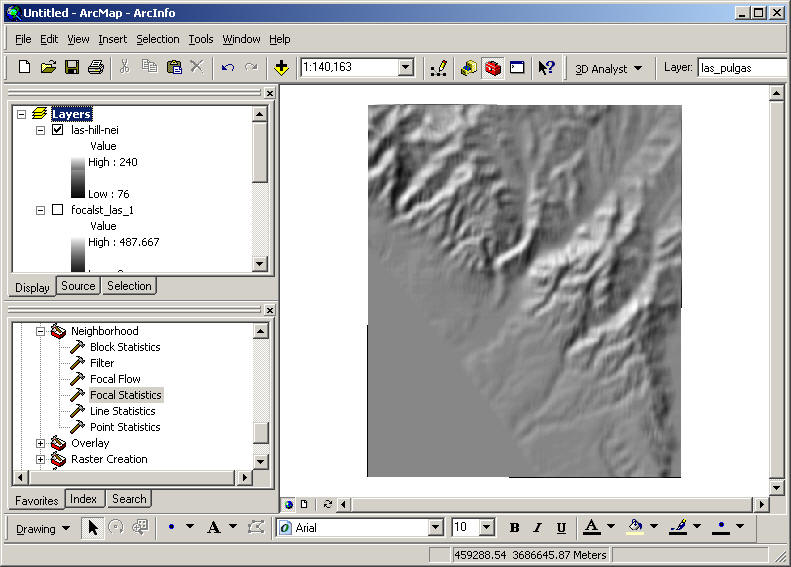
The NEW DEM show a very smooth area (after the process). Now select 3D Analyst --> surface analysis --> Hillshade. Change the Output raster to [Z:\....\###-hill-nei], then press [OK].
Now a much smooth Hillshade was created. Try to compare the differences between the original Hillshade and this one.
The next step is for the Swiss method.
![]()
SWISS Method:
The next step is for the Swiss method.
For the Swiss method, we need to create TWO new rasters from the Input DEM.
1. Select View menu --> Toolbars --> Spatial Analyst --> open the toolbar.
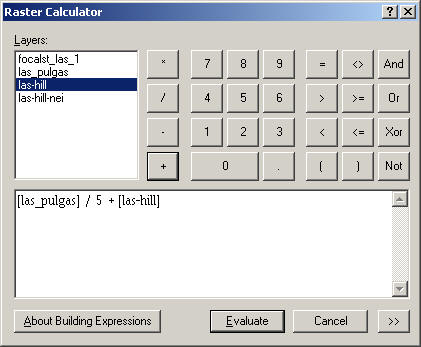
Select "Raster calculator" from the Spatial Analyst menu.
double click on your original DEM file , then " / 5 + ", then double click on the original ###-hill file as the following:
Click on Evaluate
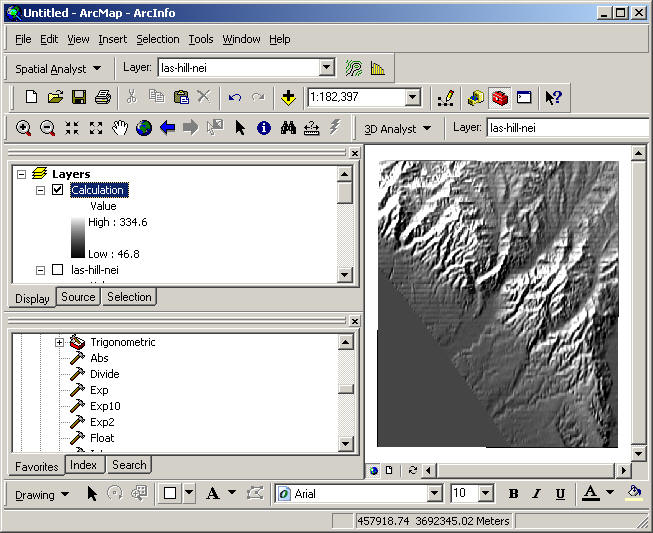
A new layer "Calculation" was created.
The next step is to save this one into your own folder. Right click on the "Calculation" --> Data --> Export Data.
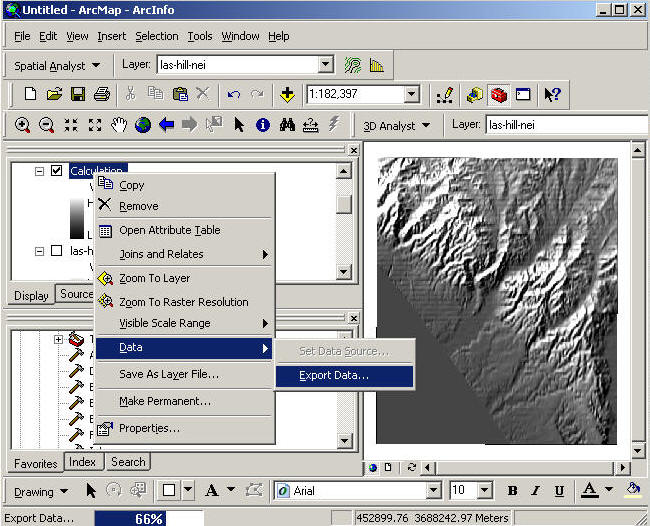
Save as "Calc42" into your own lab-02 folder.
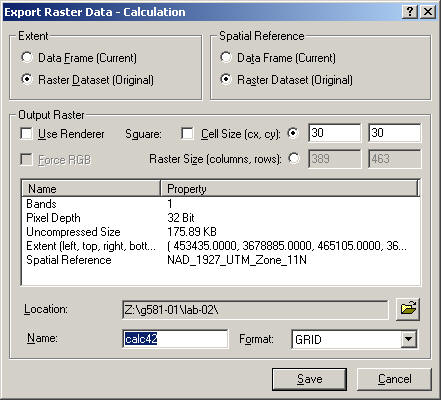
This new layer makes the higher elevations lighter and the lower elevations darker.
Now, let's make the second raster. Select the ArcToolbox --> Spatial Analyst Tool --> "Neighborhood" --> Focal Statistics
menu. Use the original hillshade as the input raster. Change the neighborhood to "Circle" and then radius to 4 cell.
Press OK.
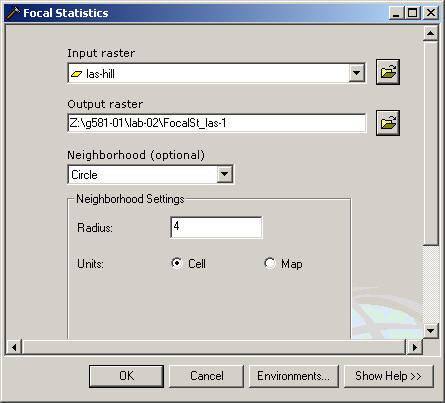
The output generalize the terrain. Now let's combine these raster files for the final display.
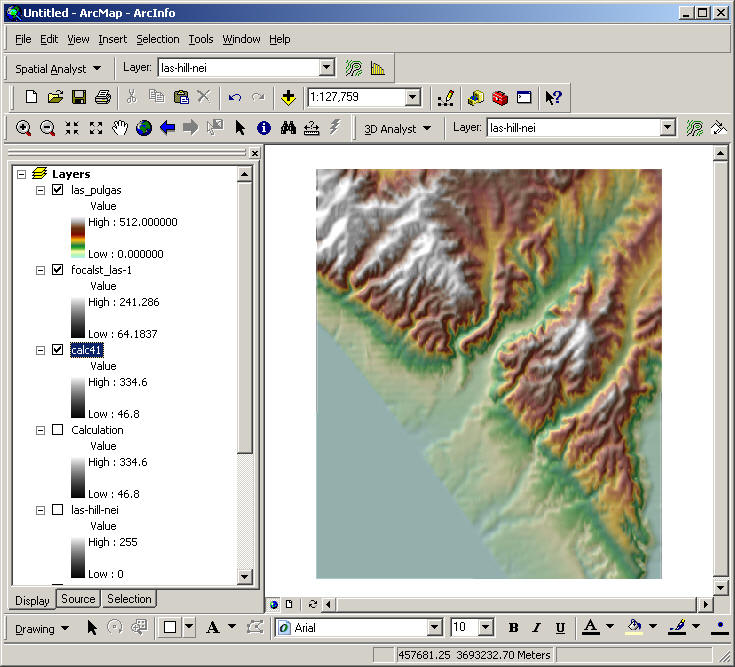
Move the original DEM to the top and symbolize with a color ram for elevation.
(double click the DEM to open property window, select the Symbology,
right click on the color ramp to uncheck the graphic view, then select Elevation #1 for color ramp.
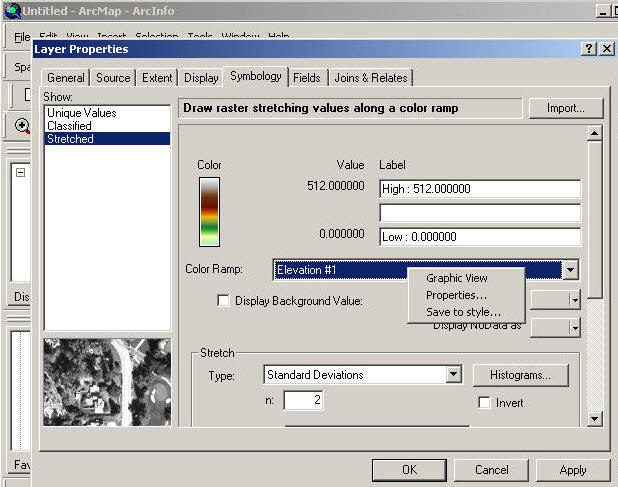
Click on O.K.
Next set the original DEM transparency to 55%.
Set up the neighborhood statistic grid with 35% transparency.
Display the calc42 layer to 35%
The final map is the Swiss style hillshade.
----
![]()
MDOW
The third method is called MDOW: Multi-directional Oblique Weighting method.
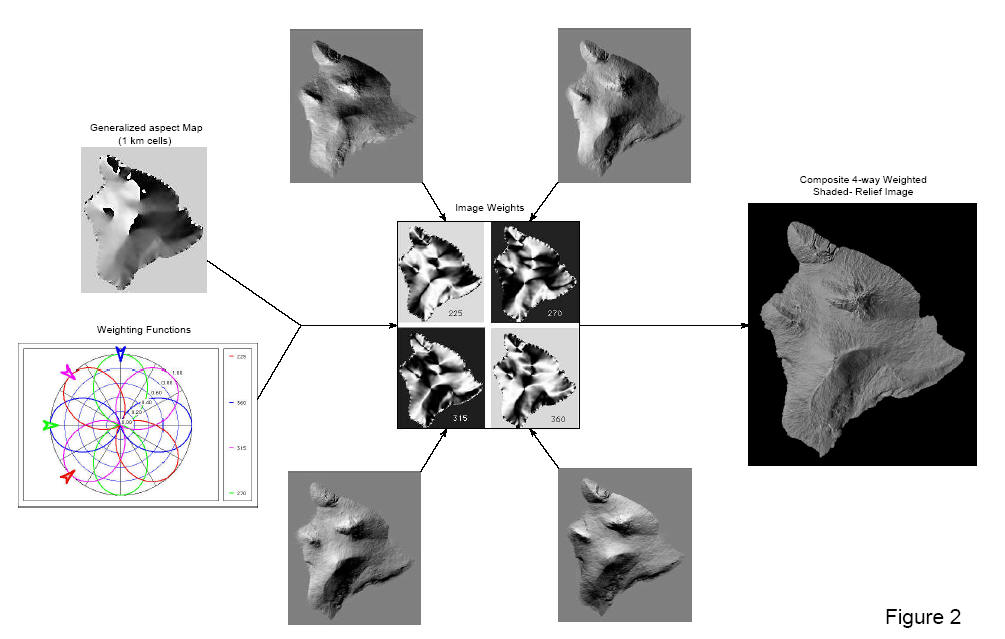
This is a very complicated method, so we will need to use "MODEL Builder" to help us.
First, Click on ArcCatalog (yellow icon) from ArcMAP
Navigate to lab-02\hillshade
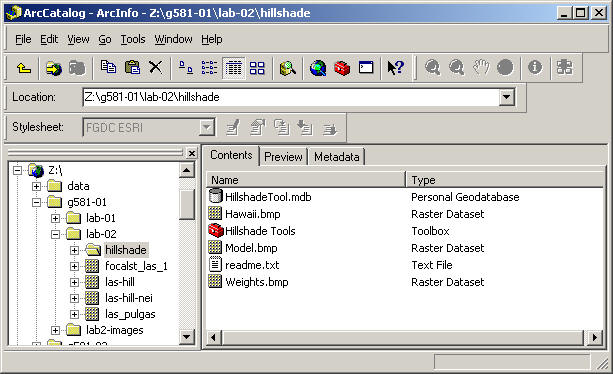
Double click on the Hillshade tool (redbox).
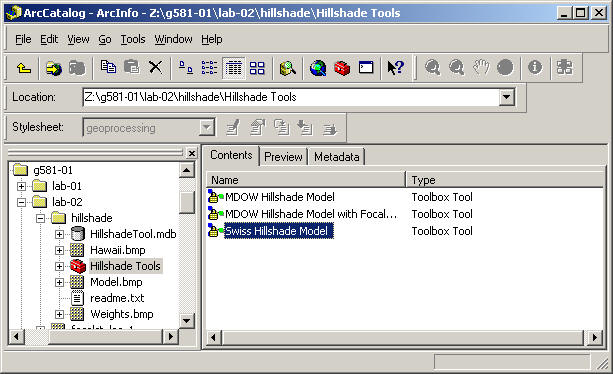
Right click on the MDOW Hillshade model and select Edit. This is the Model Builder showing the process of MDOW process.
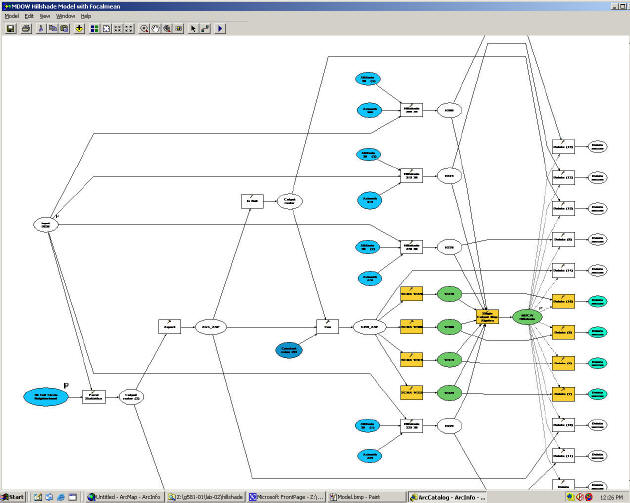
Currently, we are not able to run this model. But you can get a clear picture about how the model works.
Close the window and the ArcCatalog.
Now switch back to ArcMAP.
Now the final Task is to create a general reference map for your areas and print it out (like the one last week).
Please try to add some major-roads (majorrd), detail roads (roads), rivers (streams), major attractiion (majattr) from the SANDAGNEW data folder (under data) or CA folder and create a final printout map for this lab.
(Refer to the first lab exercise for map making).
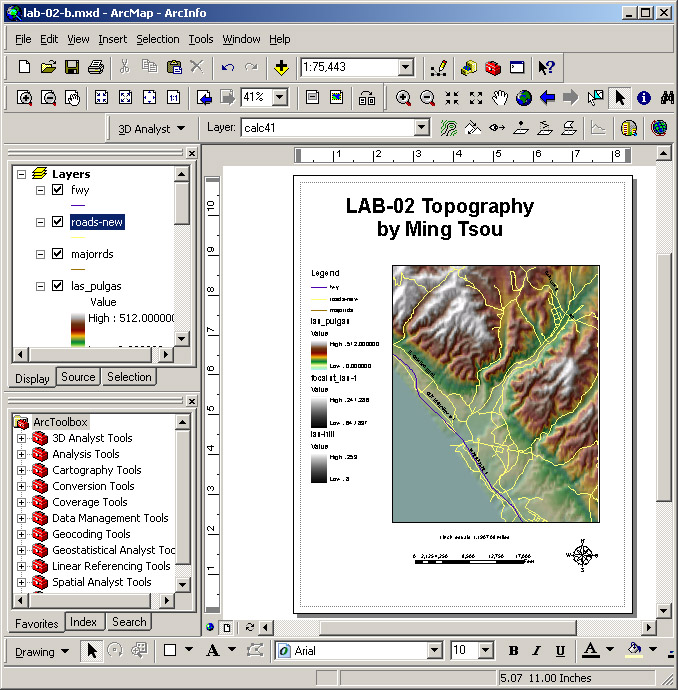
Save your final ArcMap project into Z:\g581##-\lab-02\lab-02-b.mxd.
Print out your final lab with little cesar printer (5 points).
Also, Please use on-line forum to answer the following questions (5 points)
|
Explain the color scheme used in ESRI for the slope and aspect. Highlights their advantages and disadvantages. Next, you should try to change the color scheme of slope and aspect to create your own color scheme and save the ArcMAP (lab-02-slope.mxd) into your own folder. Then explain your new choices of color scheme for slope or aspect. We will show your color scheme next week. |
|
Compare the differences between the Swiss Methods, the neightborhood methods, and the MDOW methods. (try to use the Web search engine to get more MDOW info. What's the major characteristics of each one? Which one you prefer and WHY? |
|
Find out more information about "Model Builder" from ArcGIS help or Webs. Give a brief description about its major functions. Explain the advantage and disadvantage of Model Builder. |
![]()
Web-powered by: MAP.SDSU.EDU