GEOG 581: Cartography Design
![]()
![]()
![]()
![]()
![]()
![]()
Animation for Cartography
![]()
Group Project Progress Report (Each group have two minutes).
Group 1. Visualization of change of population in San Diego County (Ken, Fred, Tod)
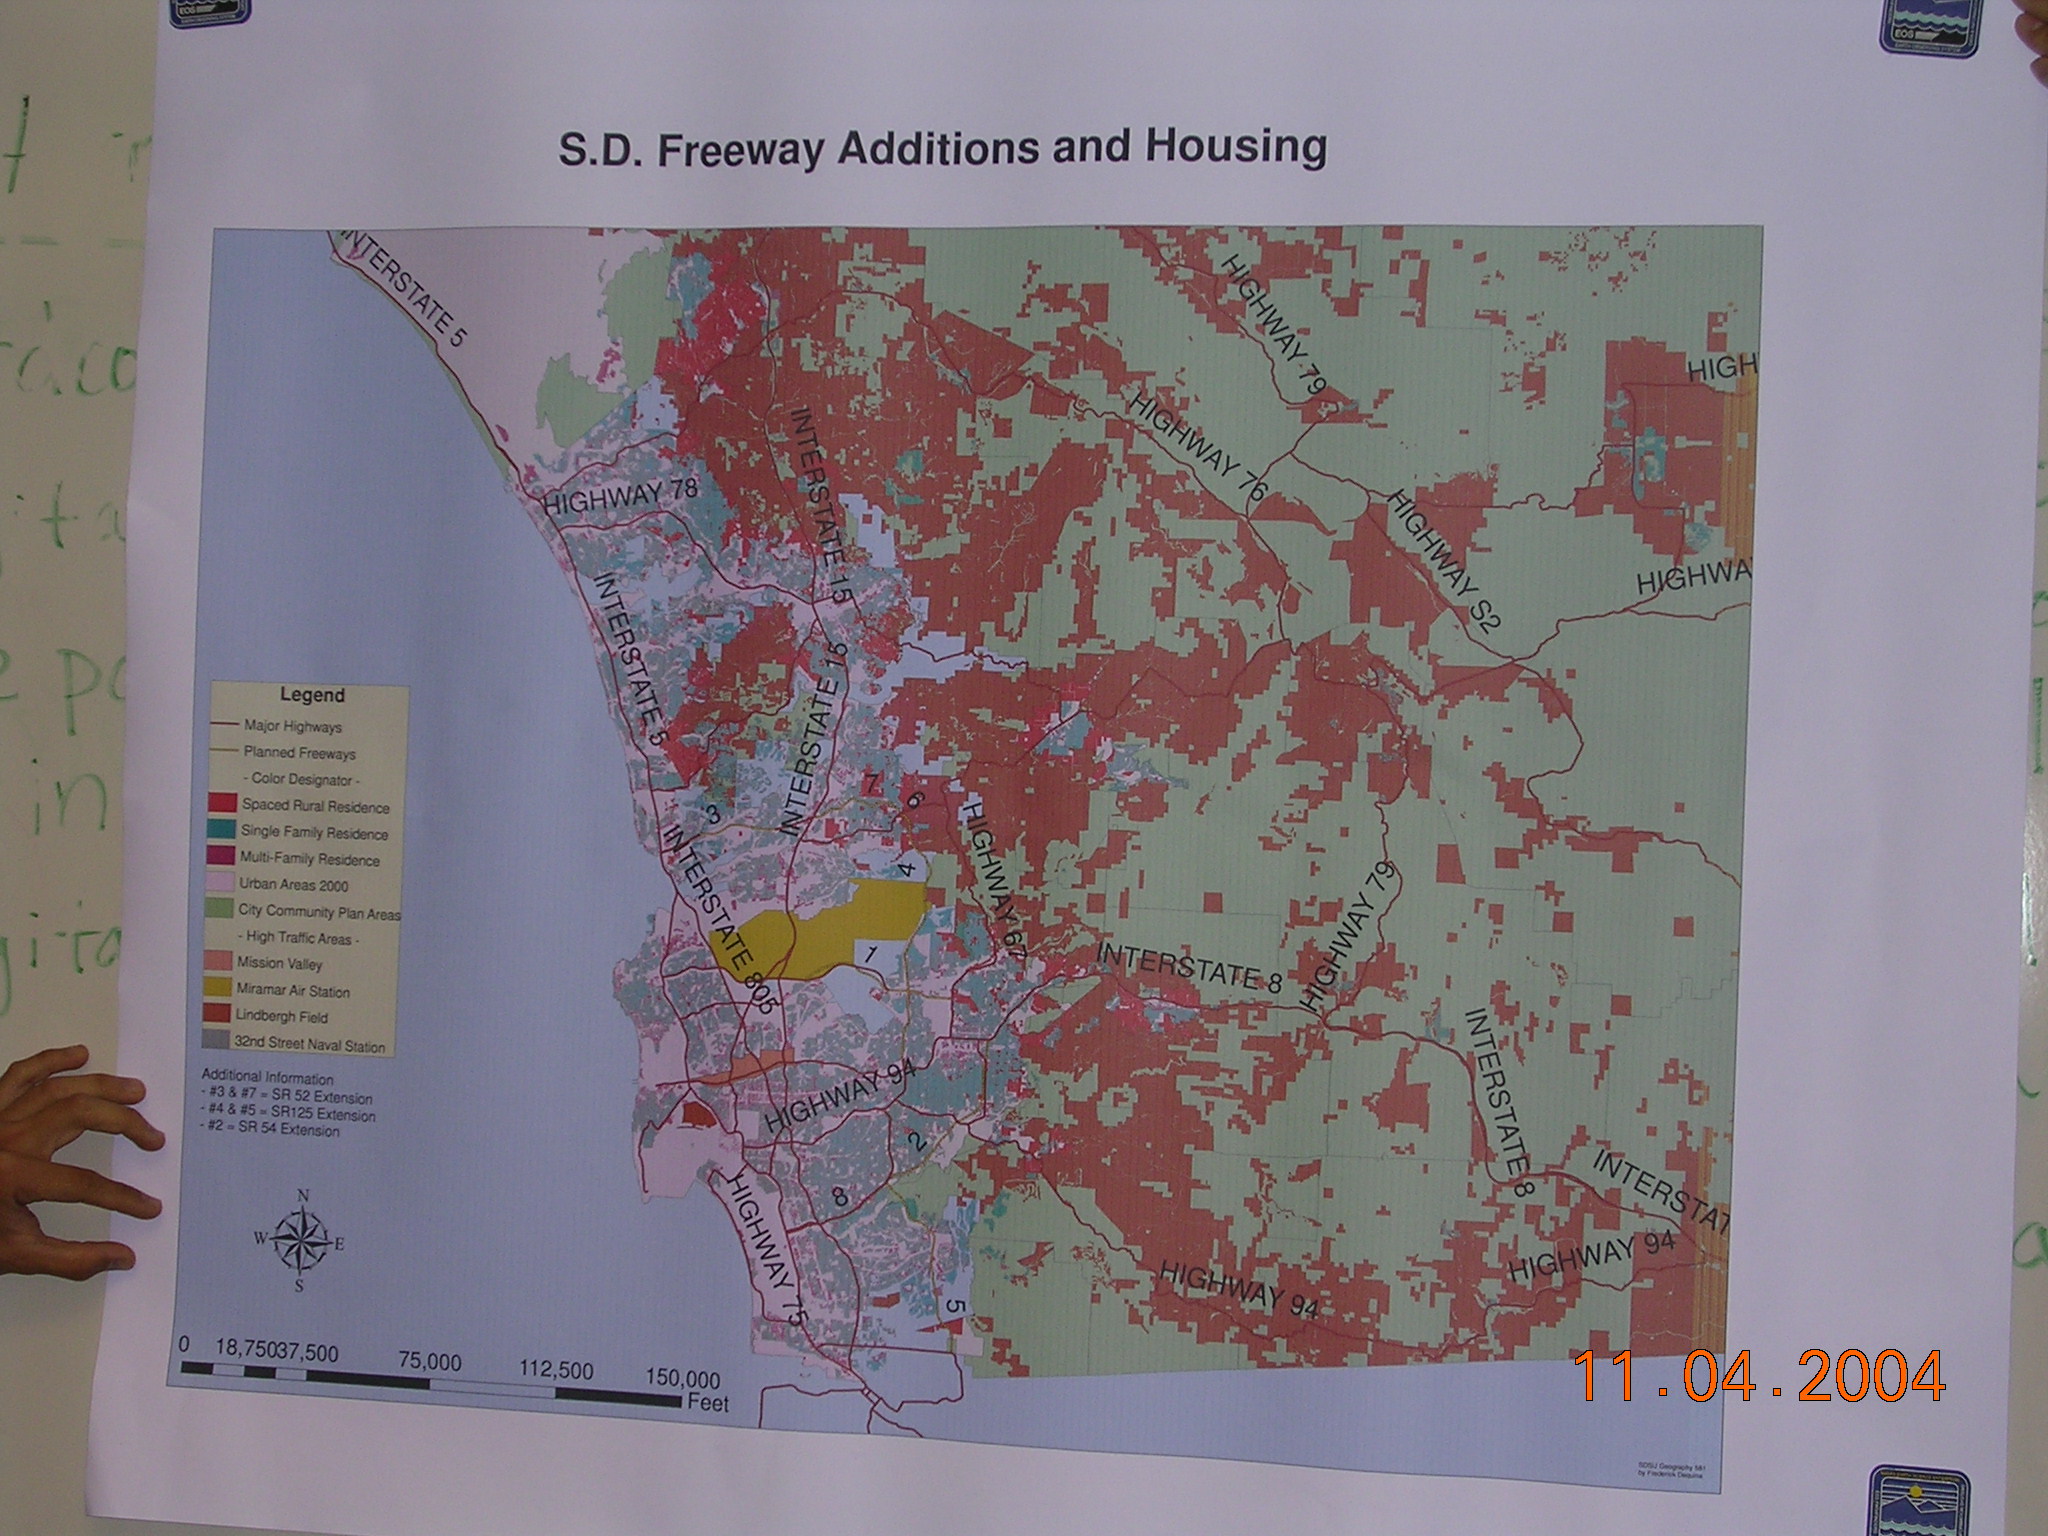
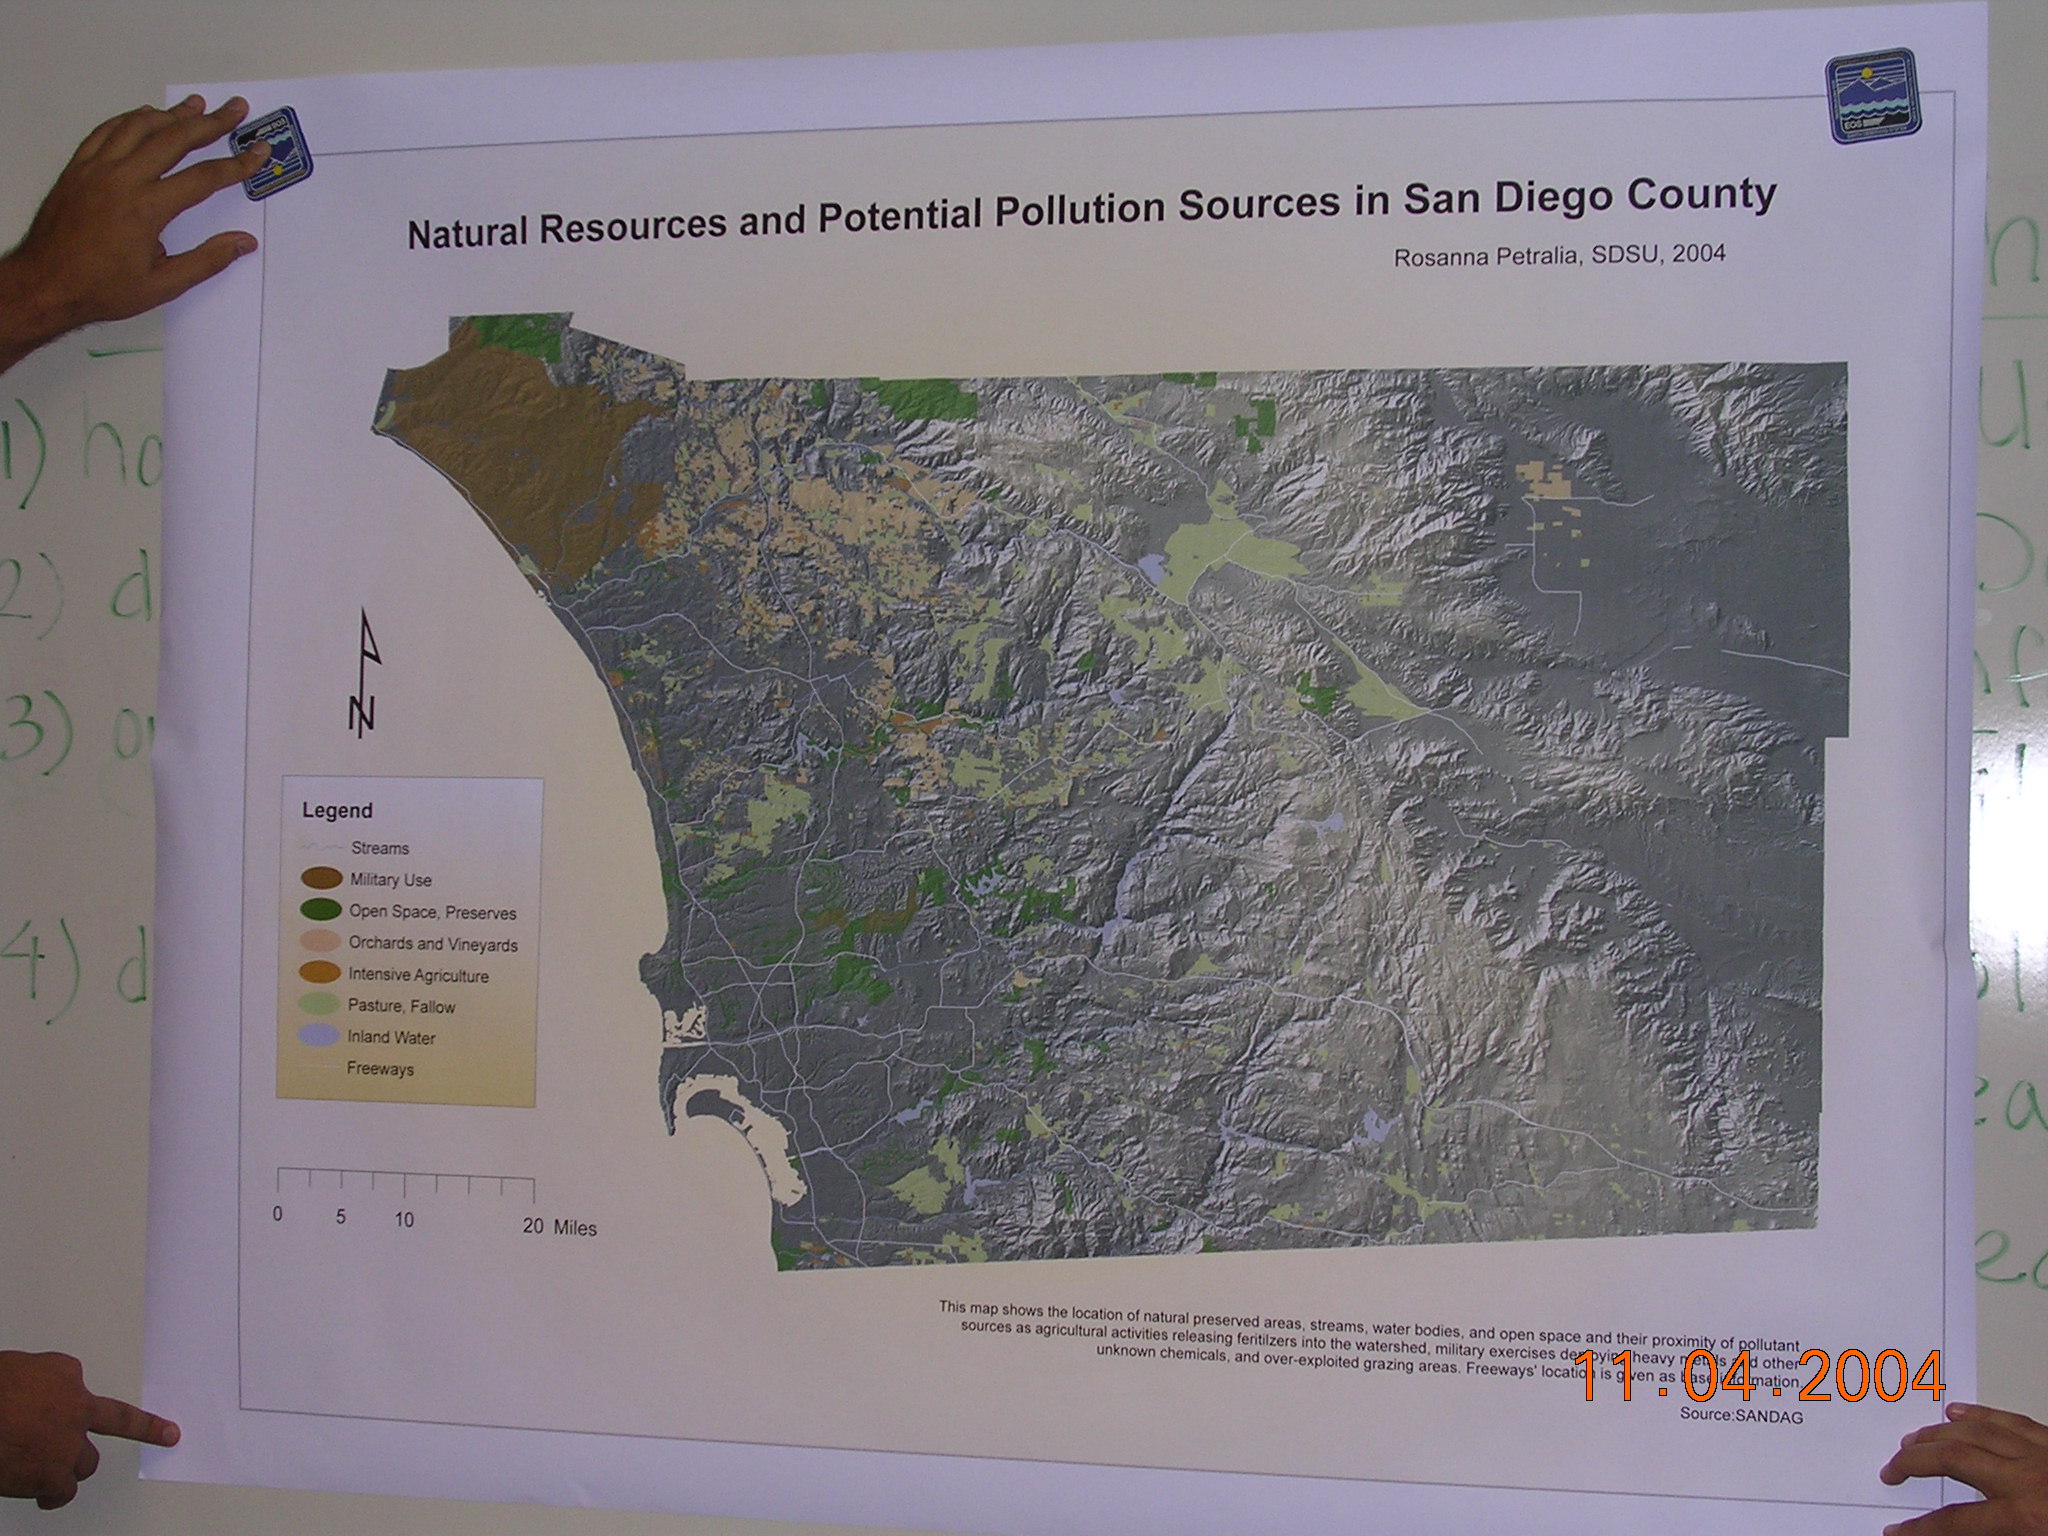
Group 2. Relocation of the San Diego International Airport (Rosanna, Addie, Lauren, and Pillip)
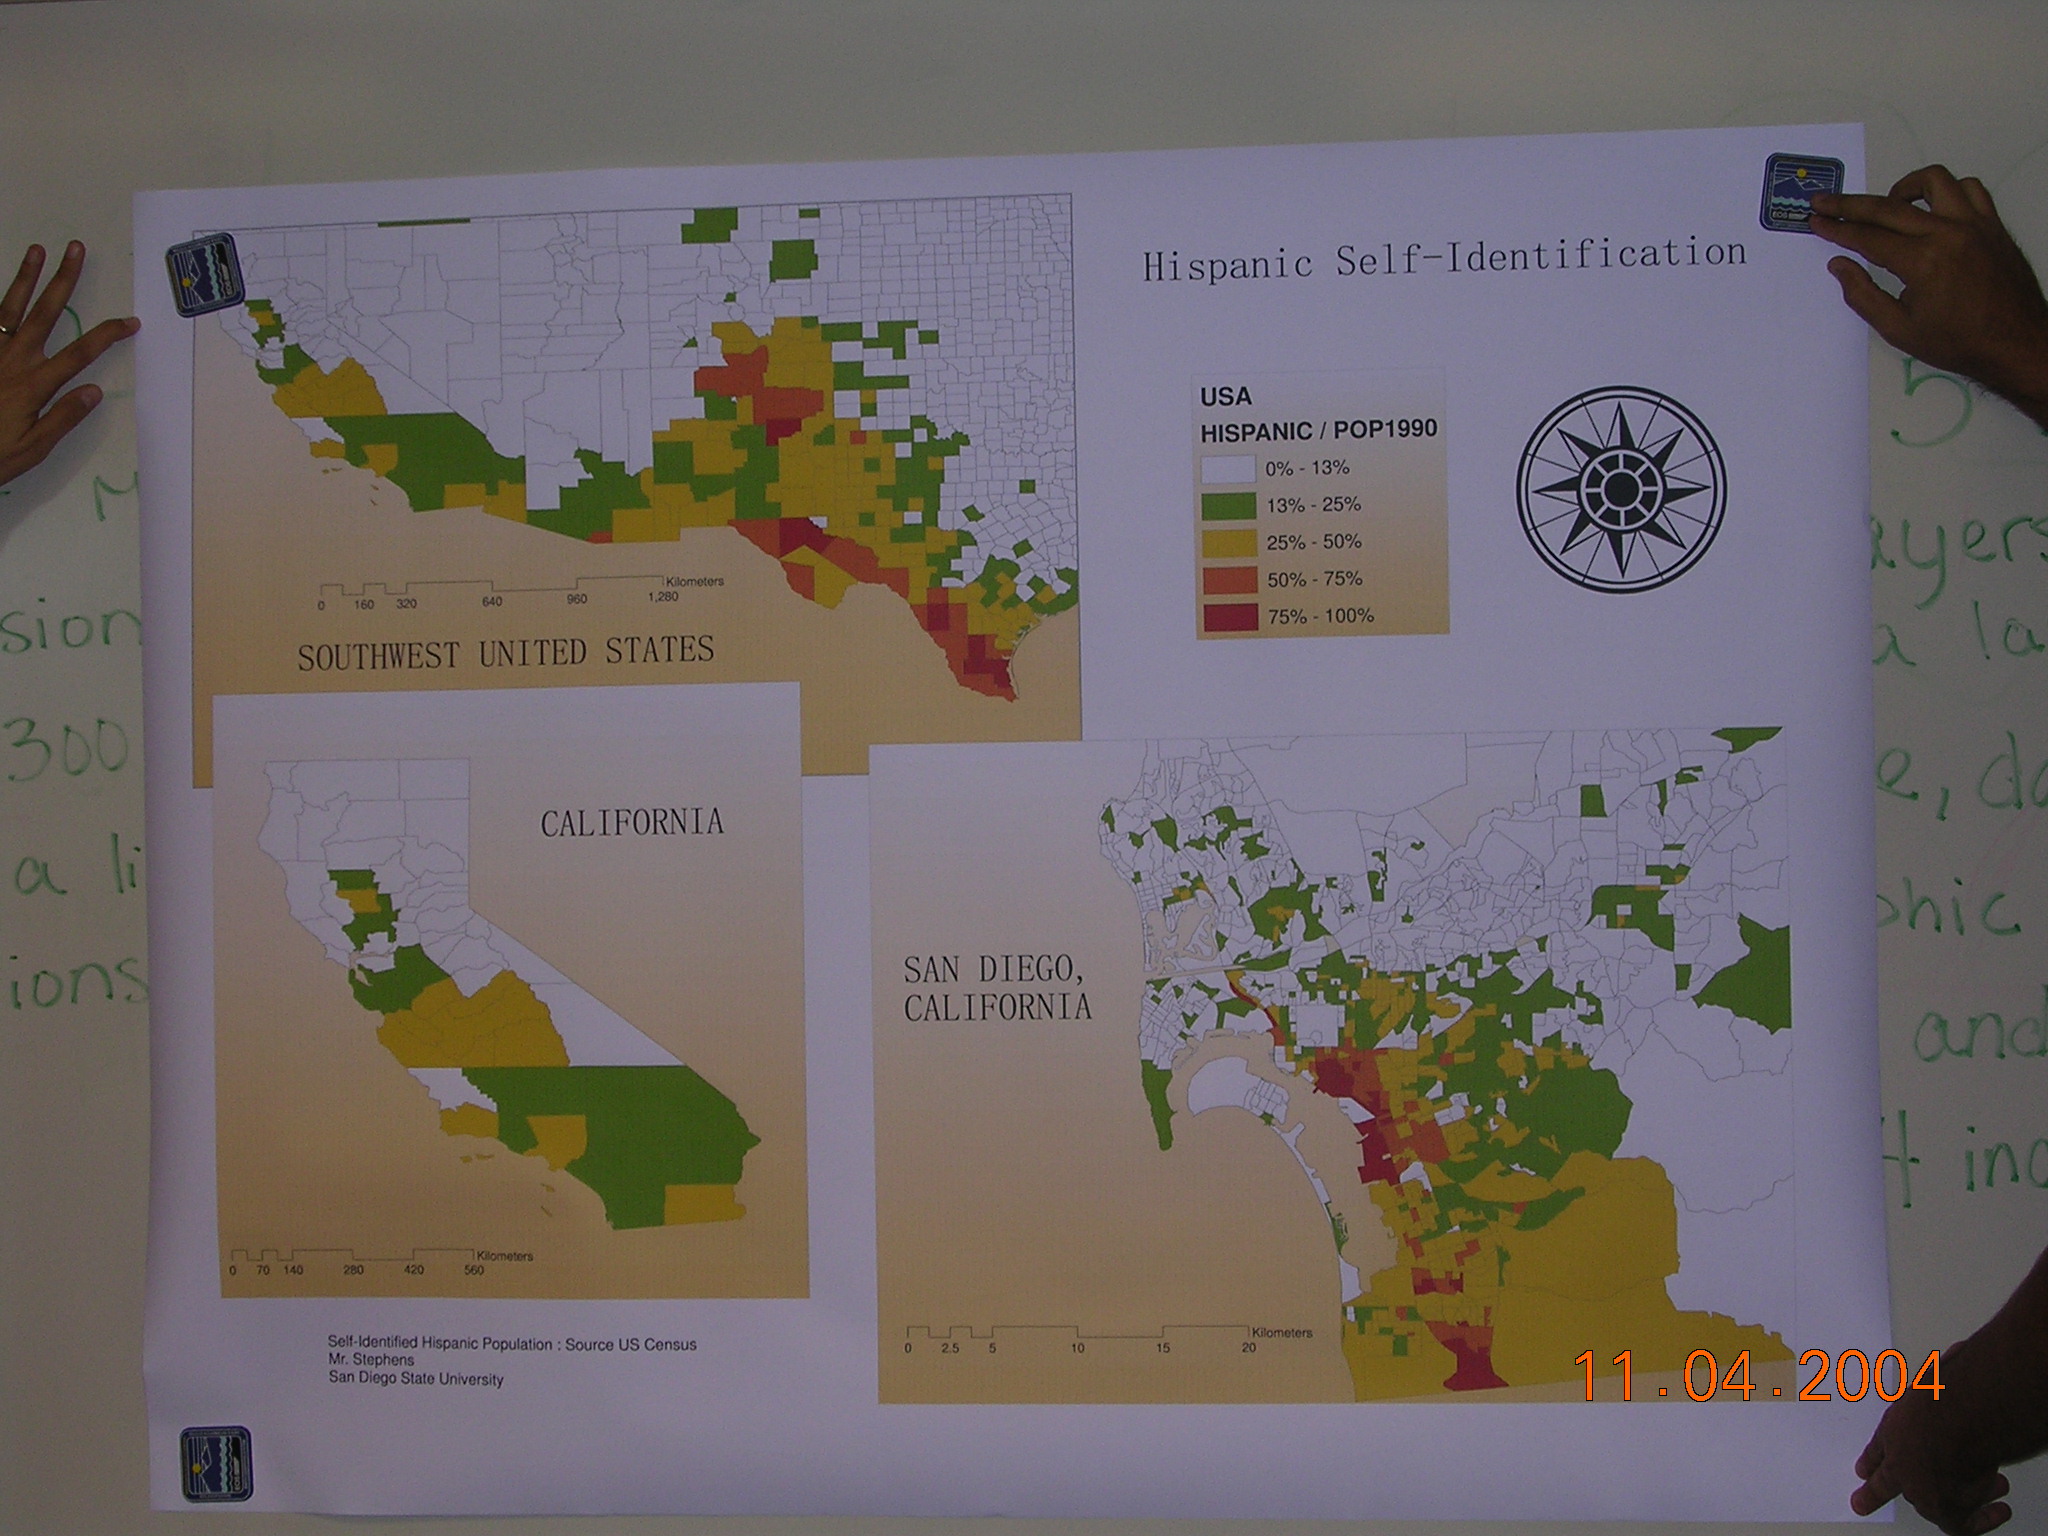
Group 3. Ecological Fallacy: A Comparative Analysis of Census Block Groups and Census Tracts. (Erica, Ahmed, and Merrilee).
Group 4. Otay Reservoir Assessment (Jing-Yi, Phillip, and David)
Group 5. Trails of Yosemite National Park (Asia, Andy, and Jennifer)
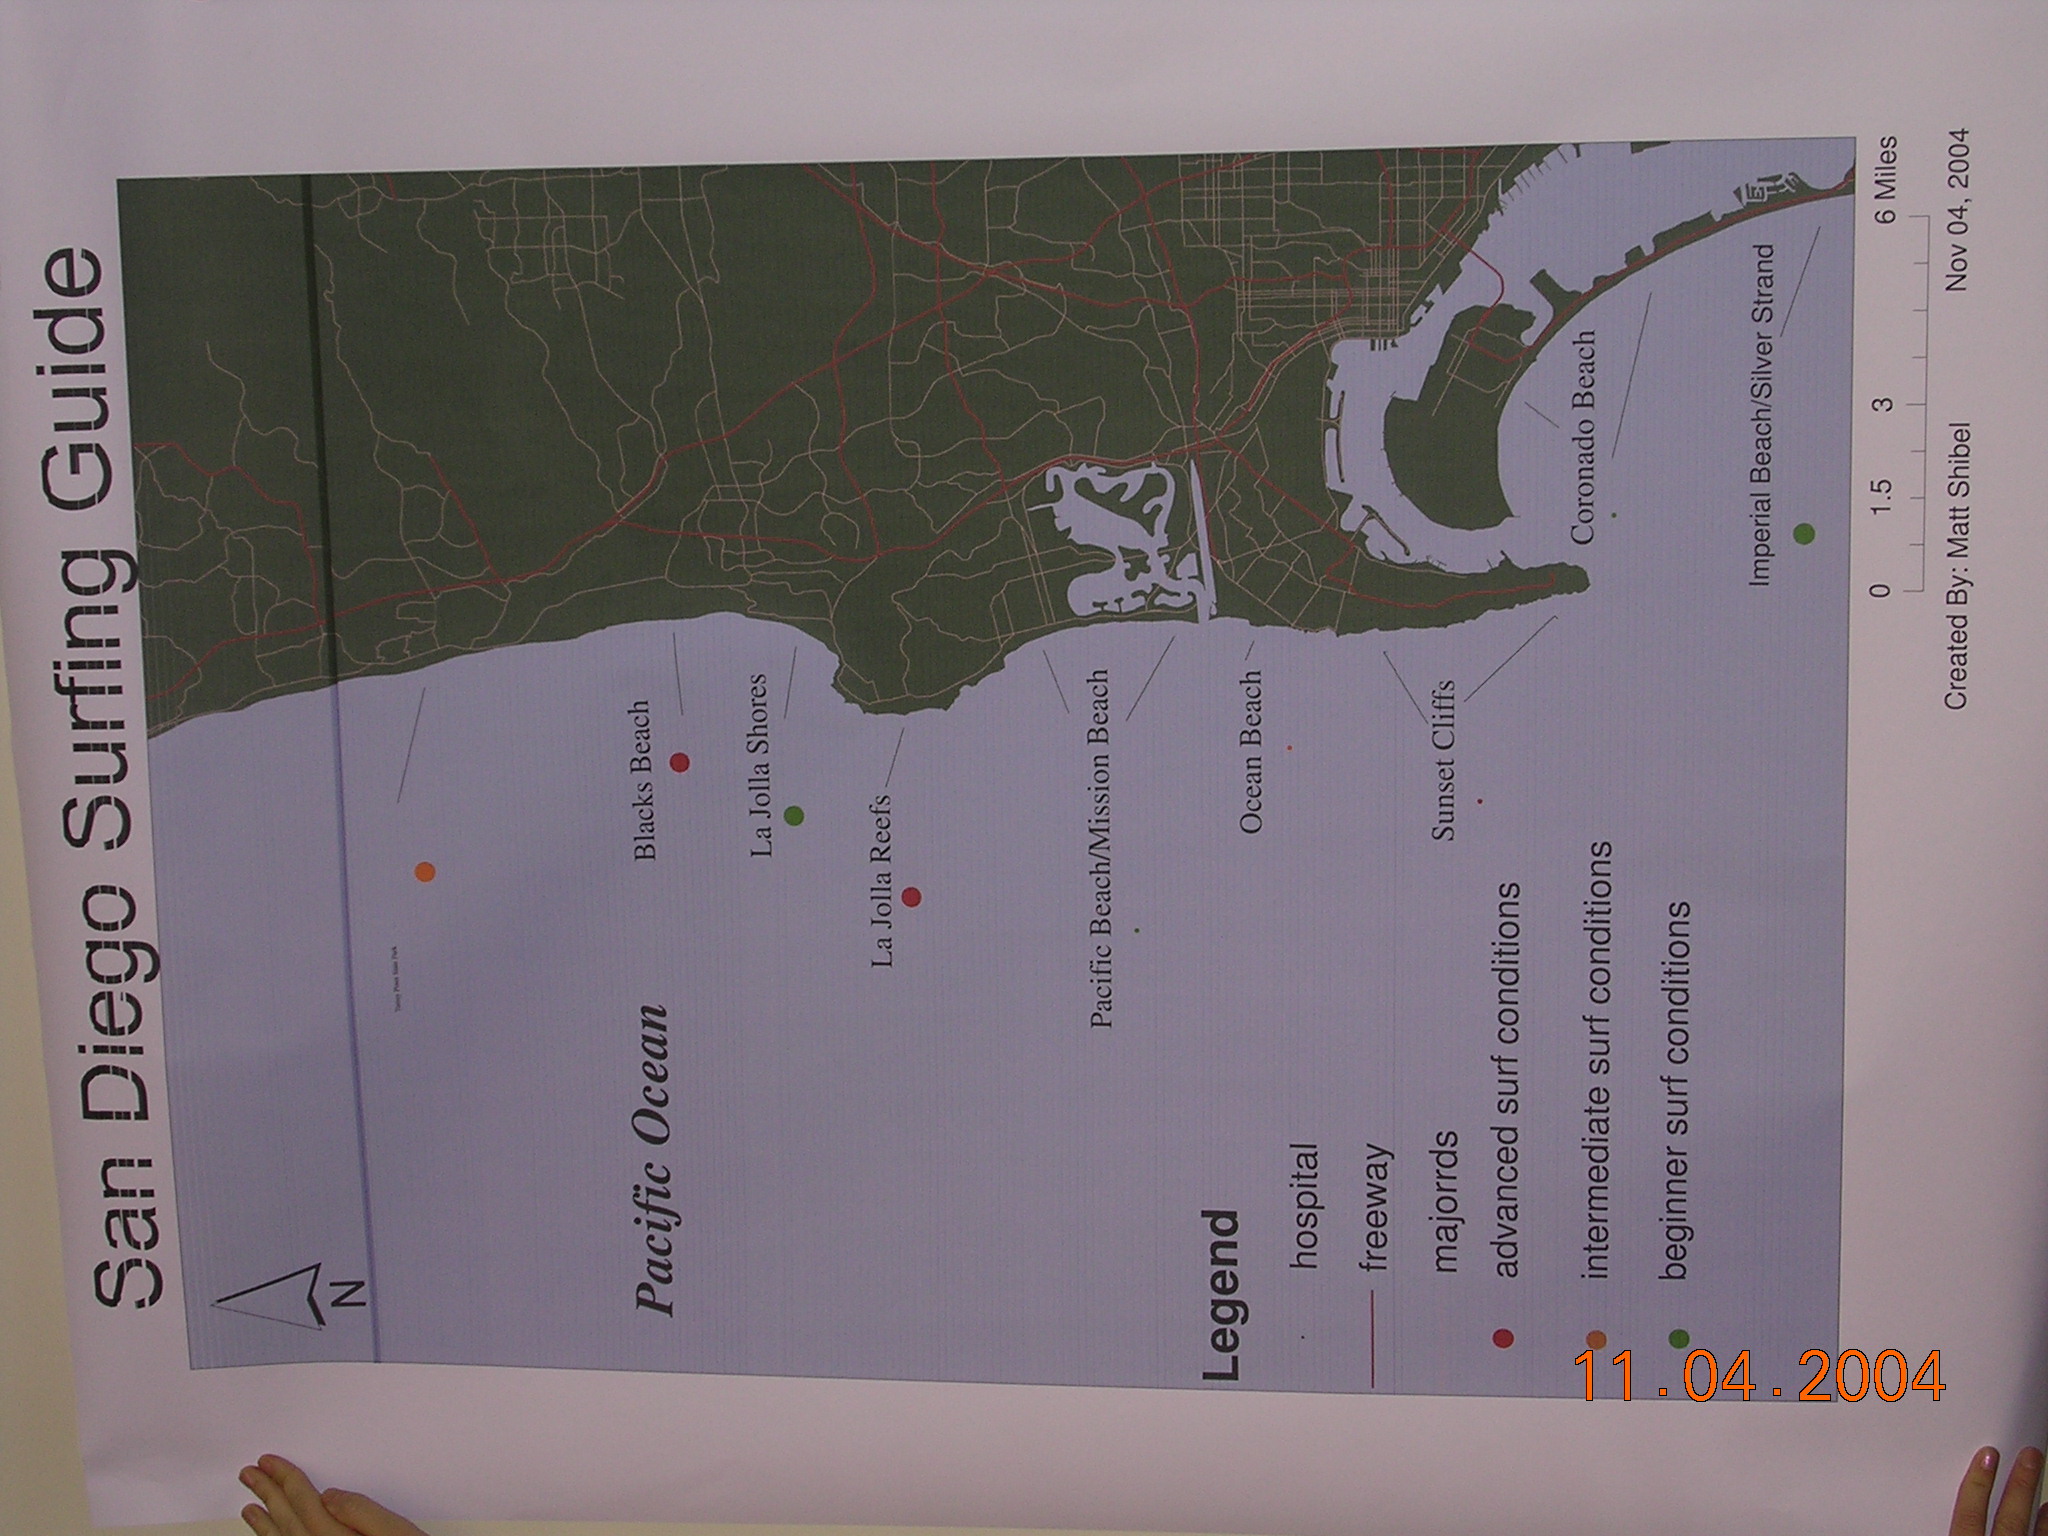
Group 6. Safe mover guide (Matt and Alvaro).
![]()
Many animation examples can be found from the textbook's website: http://www.prenhall.com/slocum/ (Slocum et. al. 2003).
(San Diego Wildfire Animation, Animated GIFs)
|
Animated shaded maps from the Kansas Data Archive (Java Applets) | |
Early development back to 1930s with camera and hand-drawing maps. --> computer-based animation: Waldo Tobler's 3D portrayal of a population growth model for the city of Detroit. (1970). (stored in Video Tape now).
1991, David DiBiase and Alan MacEachren -- define visual variables for animation and categorize various types of animation. (MacEachren, A.M. and D. DiBiase. 1991. Animated Maps of Aggregate Data: Conceptual and Practical Problems. Cartography and Geographic Information Systems 18:4, pp. 221-229.)
"Animation requires additional visual variables beyond those used for static maps, namely duration, rate of change, and order."
Duration: (d) is the length of time that each frame of an animation is displayed. Short duration --> smooth animation, long duration --> choppy animation. (slow motion vs. fast forward..) (frame 1 --> one second --> frame 2)
Rate of Change: (m/d) is the magnitude of change (m) divided by the duration of each frame (A --> A1) or (A --> C). (point --> location changes, or change the size of points)
Order is the sequence in which frames are presented. (We can re-order the frames to change effects of animation). (Back-ward play)
Example: NASA California Wildfire animation. http://svs.gsfc.nasa.gov/vis/a000000/a002800/a002858/index.html
Alan MacEachen: three more visual variables:
Display date: when the display change starts to initiate.. (population growth animation 1880 -- 1999) Examples: http://landcover.usgs.gov/urban/data.asp
Frequency (temporal texture) is the number of identifiable states per unit time. (similar to rate of changes, but this one highlights the "frequency" rather than "changes". How "smooth" or "fast" does the animation display? Examples: IBM's Deep Thunder project: http://www.research.ibm.com/weather/DT.html
Synchronization is the temporal correspondence of two or more time series. (San Diego wildfire vs. Wind direction) Example: http://www.itc.nl/personal/carto/research/webcartoforum/kenya.html
Types of Animations:
Emphasize change: change in position vs. change in an attribute.
Time series emphasize change through time. Examples: AIDS Mortality in the United States http://www.ciesin.org/datasets/cdc-nci/regions.html
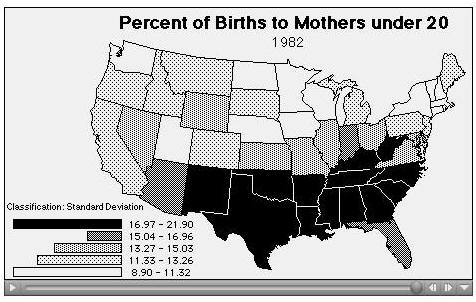
Re-expression provides an alternative graphic representation (like change the classification methods in Population density).
Dr. Michael Peterson's animation (Change of classes and change of classification methods)
http://maps.unomaha.edu/books/IACart/book.html#ANI
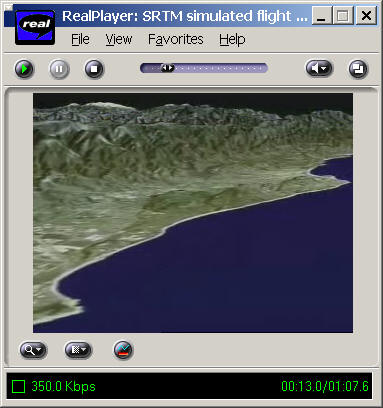
Fly-by is to fly over a 3D surface. Example: NASA JAP animation: http://www.jpl.nasa.gov/videos/earth/california/index.html#space
Emphasize location (warning signals)

Emphasize attribute
Dr. Michael Peterson's animation (Change of attributes)
http://maps.unomaha.edu/books/IACart/book.html#ANI
![]()
User Interactivity (Movies vs. Programs)
No Interaction: a movie (3D workstation, expensive to create).
NASA Animation Website: http://svs.gsfc.nasa.gov/index.html
Wilhelmson et al.’s depiction of thunderstorm development http://www.mediaport.net/fr/CP/CyberScience/BDD/fich_050.en.html

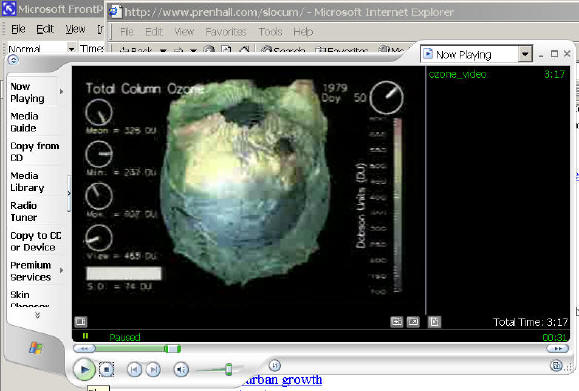
Treinish’s Climatology of Global Stratospheric Ozone http://www.research.ibm.com/people/l/lloydt/ozone_video.mpg
Interactive Animation Program (software programming + graphic tools):
Mark Harrow's Visual Benchmark (Examples of Flash Animation)
http://www.geography.wisc.edu/~harrower/dissertation/index.html
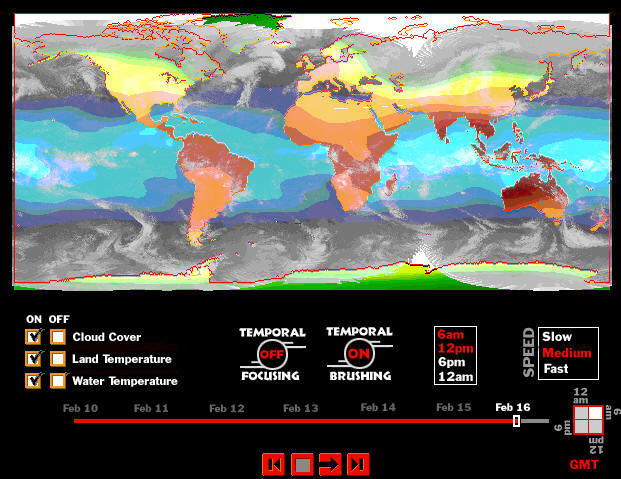
Mark Harrow's Earth Systems Visualizer (Director software) http://www.geovista.psu.edu/grants/VisEarth/animations1.html
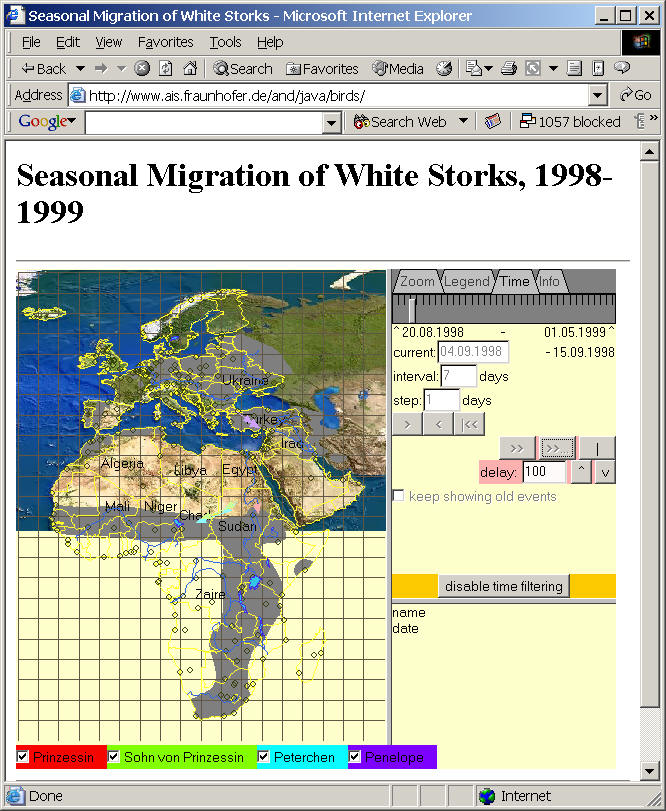
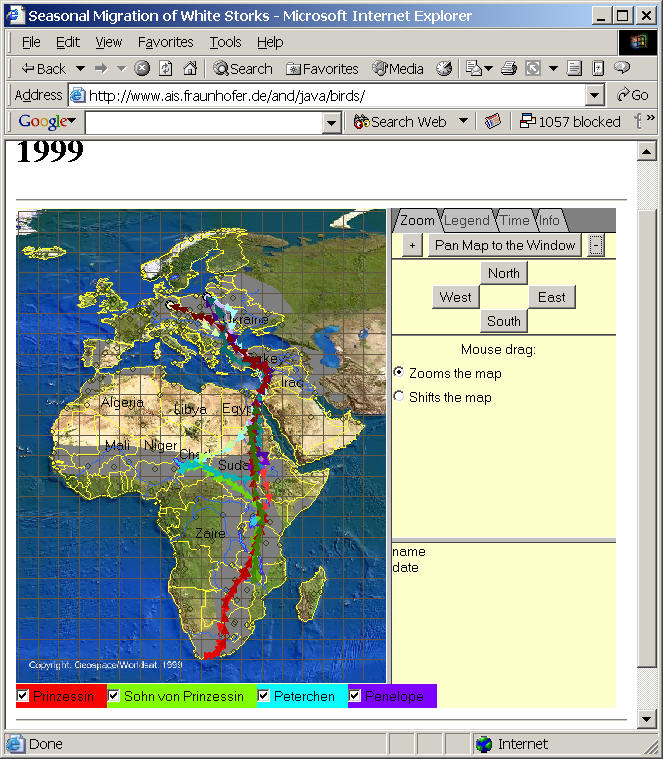
Andrienko et al’s animation of forest exports (Java applets) and white stork (Java applets)
| http://www.ais.fraunhofer.de/descartes/time/AreaAnalysis/app/efis/ | |
| http://www.ais.fraunhofer.de/and/java/birds/ |
![]()
Evaluation and Effectiveness of Map Animation ?
Difficult to compare between animated maps vs. static maps. (apples and oranges)
Animations often contained microsteps that were not available in the static map displays.
"Animations must be slow and clear enough for observers to perceive movements, changes, and their timing, and to understand the changes in relations between parts and the sequence of events. This means that animations should lean toward the schematic and away from the realistic, an inclination that does not come naturally to many programmers, who delight in graphic richness and realism.". Barbara Tversky (2002). from Slocum's book, page. 386.
![]()
Session TWO
![]()
Try more Animation Examples by accessing to the book web site: http://www.prenhall.com/slocum/
 #1
#1
 #2
#2
 #3
#3
 #4
#4
 #5
#5
 #6
#6
 #7
#7
 #8
#8
 #9
#9
 #10
#10
 #11
#11
 #12
#12
 #13
#13
 #14
#14
 #15
#15
 #16
#16
 #17
#17
 #18
#18
POSTER presentation (continue from last week)
Student's Website: HTTP://map.sdsu.edu/student581
Please use on-line forum to answer the following questions (5 points)
|
Please give ONE example of "Signs" and explain it by using Dyadic Model (Saussure) and Triadic Model (Peirce). |
|
Please go to the GIScience 2004 conference website (http://www.giscience.org) and pick up one papar session title (For example, Geographic Information Network) and discuss what are the topic covers in this session and what's their relationship to Cartographic Research. |
![]()
Web-powered by: MAP.SDSU.EDU