Web-based Exercise #2:
ArcGIS Online and ESRI Story Maps
Estimated time: 4 hours
Grading: 8 points total (ONE point for each question).
Due Day: March 01 (Thursday) at the beginning of lecture (before 2pm).
You should upload your lab answers to the Blackboard (http://blackboard.sdsu.edu) before the lecture. We will use the Timestamp on your documents in the Blackboard to check if your assignment is late or not.
(In your upload file, please use this title: [GEOG104-LAB-2-[Your name].doc (or pdf). Please write down your answers in MS Word or other word processing software. Please always save a local backup copy of your own answers.)
Please use
your own words to answer the questions in this exercises: (DO NOT
COPY any web resources or Wikipedia texts. We will check your answers
with Blackboard tools to verify that your responses are uniquely
yours.) By submitting your answers (paper) to Blackboard, you agree:
(1) that you are submitting your paper to be used and stored as part
of the SafeAssign™ services in accordance with the Blackboard Privacy
Policy; (2) that your institution may use your paper in accordance
with your institution's policies; and (3) that your use of SafeAssign
will be without recourse against Blackboard Inc. and its affiliates.
SafeAssign
accepts files in .doc, .docx, .docm, .ppt, .pptx, .odt, .txt, .rtf,
.pdf, and .html file formats only. Files of any other format will not
be checked through SafeAssign.
As for this exercise, you will need to capture many screen shots. To capture a screen shot using Windows press 'Print Screen' on the keyboard (if you are using a laptop you may have to press 'Function' and 'Print Screen'). For a Mac press Command-Shift-3 on the keyboard. Using either Mac or Windows to capture a screen shot will put a copy of your screen onto you clipboard, which can then be pasted into a document. When you open a new Word document, press "Ctrl-V" (to Paste) the screen shot into your report.
Content: Guided San
Diego Web Map creation (with online and offline data sets) and How to
Search for San Diego Data Sets (using SDSU organization account &
sharing webmaps within a group)
ArcGIS online is a Cloud computing GIS
framework. Cloud computing is a new Web technology which
can allow many users to utilize web computing resources (disk
storage, software programs, virtual machines, databases, and GIS
maps). For example, if you are using Google's Gmail and Google
Docs, they are typical Cloud computing applications. To know
more about Cloud computing in GIS, read this article:
http://www.esri.com/news/arcwatch/0110/feature.html
Join the Group in ArcGIS online
1. Go to the ArcGIS Online Home website:
https://www.arcgis.com/home/index.html Click on
“Sign in”, Then select [Create A Public Account] à select “Enter
Your Information”).
2. Fill out the information, then click
on “Create my account”.
3. You can edit your profile if you
like.
4. On the TOP menu, you can select
“Group” to join multiple GROUPS or share your maps and data among
your group members. In this exercise, you will join the
SDSU-GEOG104 group first.
5. On the top menu, select
“Groups”. Then use the “Query” function on the UPPER-RIGHT
corner, type “SDSU-GEOG104”. Your will see a group named
“SDSU-GEOG104” with owner’s name: mmingttsou.
6. Then select the “SDSU-GEOG104”
group, Select “Join This Group”. Then click on “Submit
Request” button. Your request will be reviewed by the
Instructor. The Instructor will approve your request ASAP
(within one day) to add you into the SDSU-GEOG104 Group.
Learn ArcGIS with the Online Help and
Quick Exercises
7. On the top
menu, select “Map”. A map viewer will display.
8. Open this Online Help in a seperate
window, follow their instructions, watch the intro video and finish
the two quick exercises for Maps and one for Scene.
http://doc.arcgis.com/en/arcgis-online/get-started/get-started-with-maps.htm
Maps
Watch the video:
https://www.youtube.com/watch?v=VSQ2bbI6s2A&feature=youtu.be&list=PLGZUzt4E4O2IJt1O_OTDFR-3dUpiCZGKf
Two Quick Exercises:
http://doc.arcgis.com/en/arcgis-online/get-started/quick-exercise-maps.htm
http://doc.arcgis.com/en/arcgis-online/get-started/quick-exercise-sharing.htm
3D Scene
Take another Quick Exercise for 3D Scene
function.
Quick Exercise: http://doc.arcgis.com/en/arcgis-online/get-started/quick-exercise-scenes.htm
Question 1:What are the differences between ArcGIS online and Google Earth Pro? Describe the characteristics of each. Which one you prefer? Why?
Question 2: In the "Share a Map" Quick exercise, what is the web link (URL) of your public shared map? Attach a Screen shot in your report.
Question 3: What are the differences between "Maps" and "Scene" in ArcGIS Online? Which one you prefer? Why? Attach a screen shot of the "Waterfront" slide from the quick exercise.
After completing the online tours, go to “New Map” on the top right corner.
10. In this new map, the first
task is to search for World Region boundaries and US State
boundaries. Click on “Add” on the top menu -->
Search for Layers:
Find: “region boundary” In: “ArcGIS Online”.
11. Add “USA Counties” and
“World Regions” layers into My Map.
12. Click on the bottom Blue icon
[DONE ADDING LAYERS].
When you zoom out to see the whole world
region, USA Counties may not draw completely because there are too
many features to display in this area of the map.
This problem is important for web map
display because of limited screen resolution and screen size in your
computer, each map layer should be displayed at different scale –
setting up visible range for each layer. Your Map will look
like the following figure.

13. Do you know how to set up
visible range for each map layer? (Ask the Instructor for the
answer). (Tips: In the left side of window, click on the “…”
under the layer’s name. Then select “Set Visibility Range”.)
14. Now, let’s zoom into San
Diego. Click on the “Find my Location”  below the
minus sign. The map will automatically Zoom-in into your
location (based on your computer’s location.
15. If you see a blank orange
page, don’t panic. My Map just ZOOM-INs too much. Click
on the minus sign to ZOOM-OUT slowly until you see the
boundary of San Diego County.

16. Click on
the center of San Diego County to open the information window (as a
function to query map layers). What is the total population in
San Diego County? In the window, it shows “1 of 2”, can you see the
“2 of 2”? What’s the information about “2 of 2”?
(Note: since we have included two map
layers, one map layer is World Region. Another map layer is “USA
Counties”. )
17. We will add a few more layers
to study demography of San Diego. Click on “Add” on the
top menu. Search for the following two Layers: In “ArcGIS
Online”
18. Add “USA Median
Household Income” by ArcGIS_Hub and “2016 USA Population Density"
by esri_pbi”
19. Click on [DONE ADDING
LAYERS].
20. Do you see the two new added
layers? Why? _______________________________
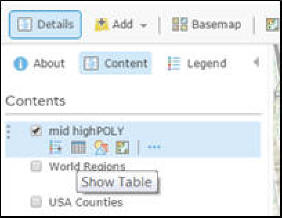
21. In the Layer [Content], you
can re-arrange the sequence of layers or uncheck the display of top
layers to see the other map layer below. Uncheck the [World Regions]
and [USA Counties] layers now. Move the USA Median Household
Income layer to the top of Population Density layer.
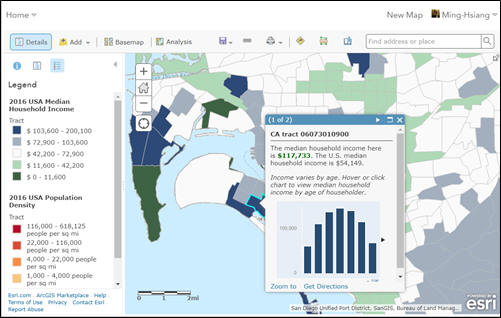
22. What do these colors means in
the Household Income map? Switch to the Map Legend View
on the Left-side Panel. Does the distribution of Household
Income make sense in San Diego? (You will need to zoom in to San
Diego to see more detail zones (zip code areas or census tracts).
23. Try to Zoom-In and Zoom out
this map to see the overall pattern of Household incomes in U.S. and
the patterns in San Diego. Do you notice the differences
between county-level maps and States-level maps?
24. You can select your interested
neighborhood and query their household Income levels. What’s
the distribution pattern in your neighborhood? (For example,
you can also try the regions in Coronado Island).
25. Now we will add one local GIS
data into My Map. Most GIS data layers in San Diego can be
downloaded from the SANDAG website:
http://www.sandag.org/index.asp?classid=21&fuseaction=home.classhome
http://www.sandag.org/index.asp?subclassid=100&fuseaction=home.subclasshome
(You need to create a free account to
download these data. It will just take a few seconds).
You can download many important GIS layers
(in Zip file format) from this website, including Schools (in
Place), School Polygons (in Place), Hospital (in Place),
Colleges (in Place), Cell_Phone_Towers (in Place), Parks,
Street_Lights (in Miscellaneous), ZipCode (in Miscellaneous).
Most of zipped file can be added into
ArcGIS online directly. But if the layer has more than 1000
feature items, it will have error messages. Since the San
Diego School files include 1082 features,we modified the files and
keep only High Schools and Middle Schools in the database. The
new file is called “mid_highschools.zip” and “mid_highPOLY.zip”.
“mid_highschools.zip” and “mid_highPOLY.zip”
Download the Two GIS datasets into your
local desktop, “mid_highschools.zip”
and “mid_highPOLY.zip”.
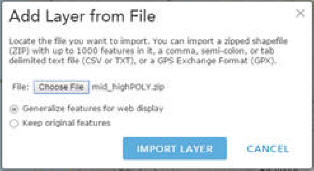
26. Let’s add the mid_highPOLY
into My Map. Click on the “Add” from top menu. It will open
an “Add Layer from File” window. Select the
mid_highPOLY (a zip file) from the workspace folder. Then click
on “IMPORT LAYER”.
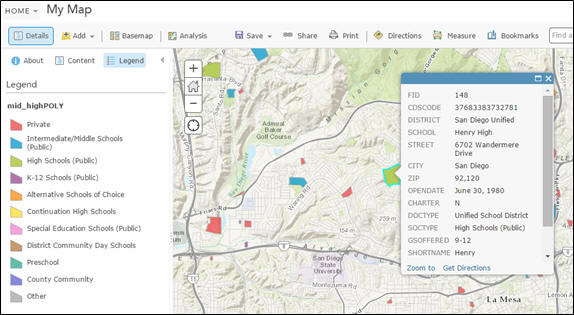
27. ArcGIS online has detected
this GIS layer has a few “attributes” to display. In the Option
1, Choose an attribute to show --> select “SOCTYPE”
(school type). So each type of school polygons will be displayed in
different colors. The second option is to choose a drawing
style with Types (unique symbols) or Location (single symbol).
The default choice is Types. Keep the default. Then
click on “DONE”.
28. Now Turn off the
Median Household layer. Can you see the new mid_highPOLY
layer (Middle schools and high schools in San Diego)? Try to
Zoom In to see.
29. Click on one color polygons to
see the information in the window. Does the color match its TYPE?
30.
31. Zoom-in to one high school
polygon. Do you know what’s the median household income
nearby that high school? Turn on the “USA Median Household
Income”. Now the two map layers are difficult to recognize.
To improve the display of the map. You need to change the “Transparency”
of the “USA Median Household Income” layer.
32. Click on the “. . .”
below the 2016 USA Median Household Income” layer. Select
Transparency à Change to 50%.

33. Change the Transparency of
mid_highPOLY to “0%”. Now the map looks much better.
34. Click on the center of your
selected school polygon. In the Popup Info window, change the Page to
Second Page (2 of 2) to see the nearby household incomes.
Click on anearby polygon and do the similar analysis. What is
the average household income nearby your selected school?
_____________________
35. Use the Measure Tool to
measure the area of your selected school. The measure tool is on the
top menu. (You should change the unit to Sq Yards). How
many Sq Yards in your School?
36. Now we can add a Map Note into
your School. Click on the “Add” on the Top menu, select Add
Map Notes. Type “San Diego School” and select “Infrastructure”
template.

37.

38. Currently, you are in the
“Edit” Mode in ArcGIS online. You can see that the “Edit” icon
on the TOP menu is activated. To complete this Edit session,
click on the “Edit” button to turn of Edit Model.

39. Now you can test your new Map
Note. Click on the School map symbol to see what
happens.
40. Now Zoom-out a little bit to
see the Household income layer to display on the map. Click on
the Bookmarks (on the Top menu) --> Add bookmark
to bookmark this view. (type in your own description).
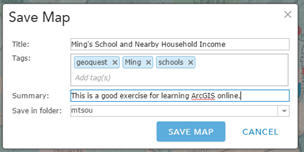
41. Now we need to save our work.
Click on the [Save] on the top menu -> [Save]. In the Save Map
window, input Title, Tags, and Summary. In the Tags, please add
the first one for “GEOG104”. The title and tags are
searchable text when you share or publish your maps. So be careful
about what kinds of information you put in these fields. Click
on “SAVE MAP” when you finish. This web map will be
saved into your Content associate with your ArcGIS online
organization account.
42. One powerful function of
ArcGIS online is to share your maps with others. Click on “Share”
button on the top menu, the Share window will pop-up. You can
share your map to everyone, or to your organization (SDSU), or
members of your groups. You can also share this map with your
Facebook or Twitter Account.
43. In this exercise, you will
share your map with SDSU-GEOG104 group. Click
on the “Share” icon (next to the SAVE icon).
44. In the Share window, select “SDSU-GEOG104”
as the group to share. Then click on “DONE” in the bottom of
window.
45. Optional: You can also
share your map with Web App. To do so, click on “Share” again,
and then select the “CREATE A WEB APP” on the bottom of
window. You can also use this tool to create Story map which we
will cover it in the next exercise.
46. Create Your OWN Web Map
and Share with Our Group!
Now you can modify your current maps by
adding other map layers you found from ArcGIS online or SANDAG
website. Please add at least TWO new map layers in your new
map or create a brand-new one map from your own topics. Save your map and Share your new map with a new name
to the Group of “SDSU-GEOG104”.
ESRI Story Map Exercise
1.
Spend 15 minutes to read this Story Maps Tour Tutorial Example
: http://storymaps.arcgis.com/en/app-list/map-tour/tutorial/
(You don't need to follow this procedure yet).
2.
Take a look at some good examples of ESRI Story Maps:
https://storymaps.arcgis.com/en/gallery/#s=0https://storymaps.arcgis.com/en/gallery
3.
There are several types of Story Map Builder to select (Map
Tour, Map Journal, Cascade, Map Series, and Basic, etc.). Go to
the app-list to take a look these different templates:
http://storymaps.arcgis.com/en/app-list/

4.
Now you are ready to create your first Story map. Select
one of the Story Map Templates (Tour, or Journal, or Series, or
others). Then click on the “TUTORIAL” in your selected
template. Finish the tutorial by following these instructions.
Please make sure to use the organization account you created from the
previous lab.) and Share the final story map with the Public.
5.
Select another ESRI Story Map template and complete the
tutorial.
6.
You must complete TWO different TUTORIALS from these Story
Map templates in this exercise. Please make sure to include maps in
your Story Map examples.
7. If you need some pictures for your tutorials, there are some SDSU pictures and San Diego Pictures available in HERE. https://pixabay.com/
IMPORTANT: Please DO NOT copy or use photos from any commericial websites unless they are "Creative Commons".
Questions 7:
Select your favorite ESRI Story Map Example from the Gallery and
provide a brief introduction with URLs. Why are you selecting
this Story Map? Who are the map makers and map readers?
Question 8: Introduce the TWO ESRI Story Maps you created and provide the URL
links. Explain why you choose the template and what are the
advantages and disadvantages of the template you choose.
Due Day: March 01 (Thursday) at the beginning of lecture (before 2pm).
You should upload your lab answers to the Blackboard (http://blackboard.sdsu.edu) before the lecture. We will use the Timestamp on your documents in the Blackboard to check if your assignment is late or not.
(In your upload file, please use this title: [GEOG104-LAB-2-[Your name].doc (or pdf). Please write down your answers in MS Word or other word processing software. Please always save a local backup copy of your own answers.)
Web Exercise
Questions:
Question 1:What are the differences between ArcGIS online and Google Earth Pro? Describe the characteristics of each. Which one you prefer? Why?
Question 2: In the "Share a Map" Quick exercise, what is the web link (URL) of your public shared map? Attach a Screen shot in your report.
Question 3: What are the differences between "Maps" and "Scene" in ArcGIS Online? Which one you prefer? Why? Attach a screen shot of the "Waterfront" slide from the quick exercise.
Questions 7:
Select your favorite ESRI Story Map Example from the Gallery and
provide a brief introduction with URLs. Why are you selecting
this Story Map? Who are the map makers and map readers?
Question 8: Introduce the TWO ESRI Story Maps you created and provide the URL
links. Explain why you choose the template and what are the
advantages and disadvantages of the template you choose.
