Multiple Species Conservation Program (MSCP) Habitat Monitoring: Remote Sensing Research at San Diego State University
|
Multiple Species Conservation Program (MSCP) Habitat Monitoring: Remote Sensing Research at San Diego State University |
Image-Ground Relationships
Field sampling of vegetation cover was conducted at each study site. The field sampling scheme was designed to allow detailed analysis of vegetation type, structure, and condition as well as provide ground truth data which can be used to validate remote sensing products. The diagram below shows the sampling scheme which attempts to capture the variability of habitat type and quality within reserve areas. The urban and transition zone plots are supposed to provide indications of urban impacts on habitat quality, while the core area is supposed to represent undisturbed habitat. The 3x3 meter plots were specifically designed to be used in conjunction with high resolution ADAR data to aid in calibration and validation of image derived products.
MSCP Habitat Monitoring Site: Mission
Trails Regional Park
Three 100 x 50 m plots; sixteen 50 m transects; 1 m intervals
10 - 15 person-hours to establish and GPS
survey sample plots (crew of 2 -3 people)
60 - 70 person-hours to identify and record
species/surface cover (crew of 5 - 8 people)
80 - 90 person-hours to encode and structure database (crew of two people)
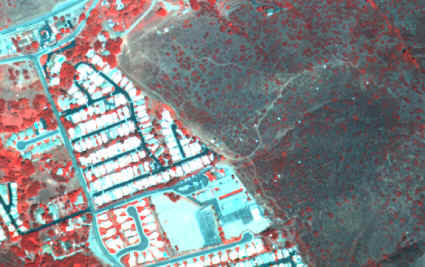
The image below is a subset of a 1 meter ADAR scene of the Crestridge study area showing markers (small white dots in the image) that were placed on the ground near the corners of the sampling plots.
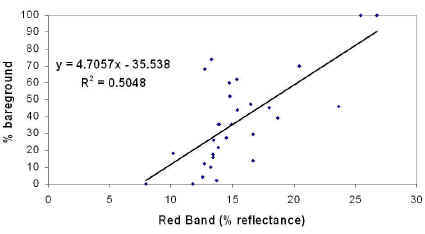
The plot below represents the relationship between percent bare ground cover derived from the 3x3 meter sampling plots and 1 meter ADAR reflectance data of the red spectral band. While the R square is not very high, it is still obvious that there is some correlation between the image data and ground truth.