![]()

Geographic Information Science and Spatial Reasoning
(GEOG 104) (A General Education [GE] Course) Spring 2018
![]()
![]()
![]()
|
Geographic Information Science and Spatial Reasoning (GEOG 104) (A General Education [GE] Course) Spring 2018
|
|
| |
|
Geographic Information Science and Spatial Reasoning (GEOG 104) (A General Education [GE] Course) Fall 2015
|
Unit 6.1
GIS Data Collection and Database Management
GIS Data Collection is one of the most expensive GIS tasks! (In a traditional GIS project, the cost of GIS data collection can be 80% of the total project budget.)
First-Hand (Primary) GIS sources: remote sensing images, GPS, survey data;
(Primary data sources are those collected directly in digital format specifically for GIS use.)
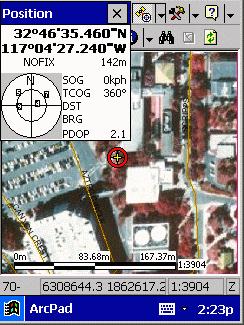
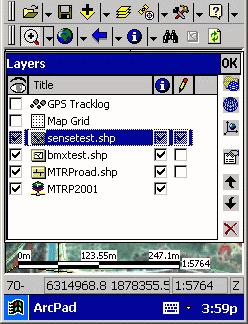
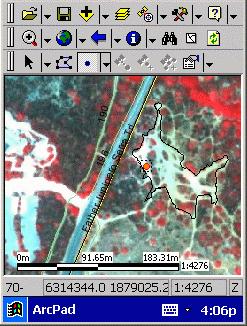
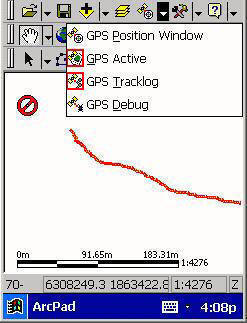
Example1 : GPS tracking function in field survey. (vector-examples):
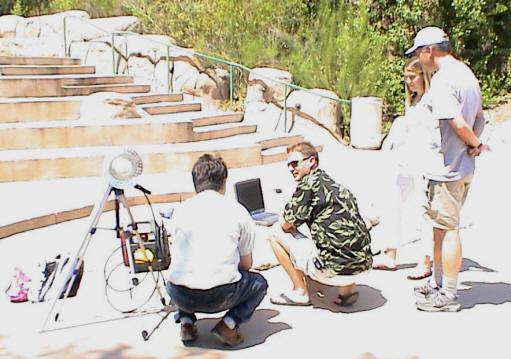
http://map.sdsu.edu/mobilegis/photo_mtrp.htm
|
|
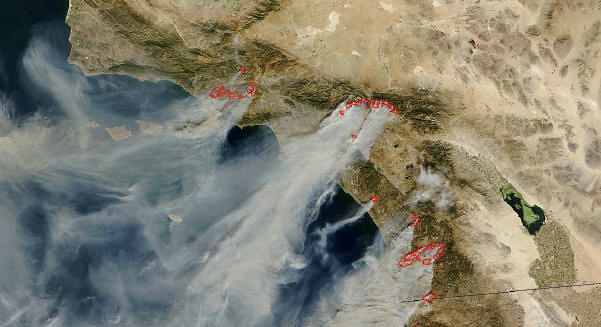
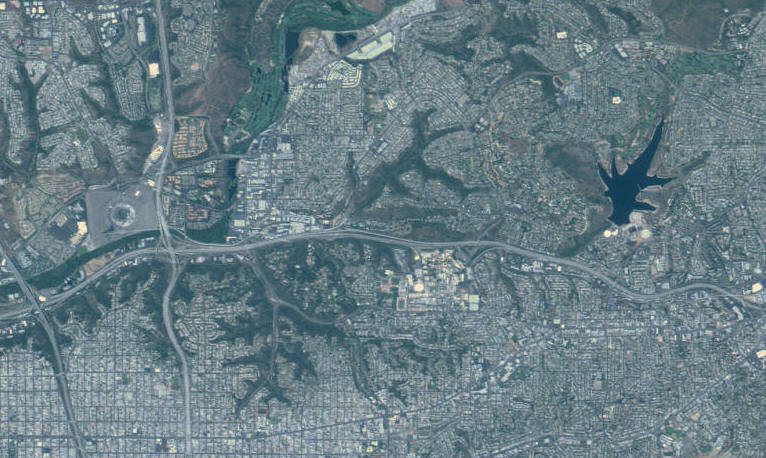
Example 2: Satellite Imagery: FORMOSAT-II (San Diego Region).
http://www.spotimage.fr/html/_167_171_977_.php
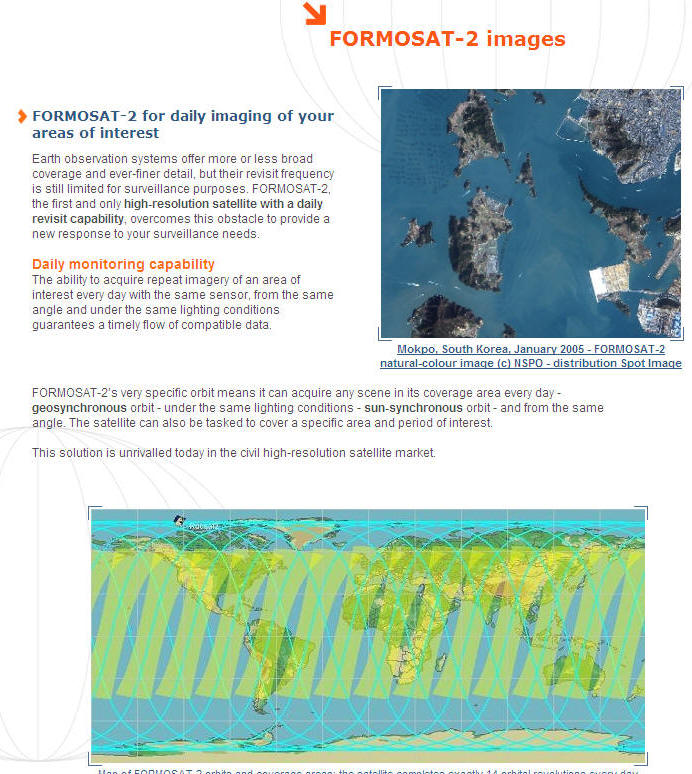
Images from http://www.spotimage.fr/html/_167_171_977_.php
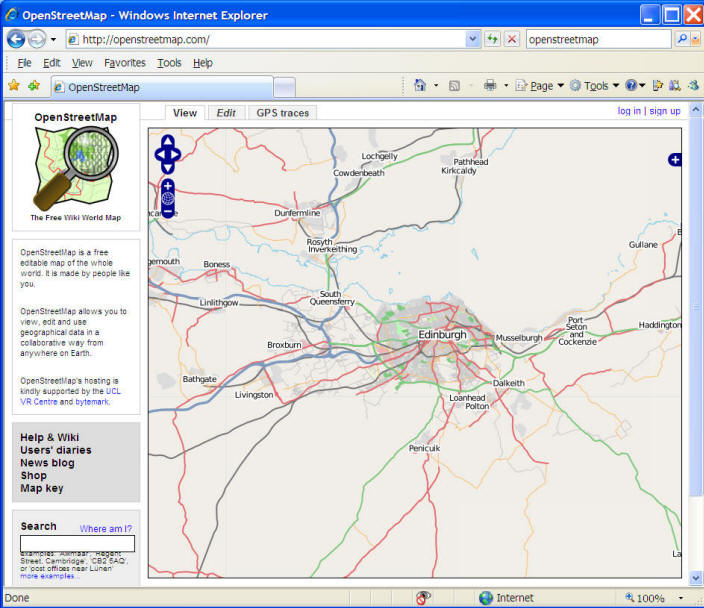
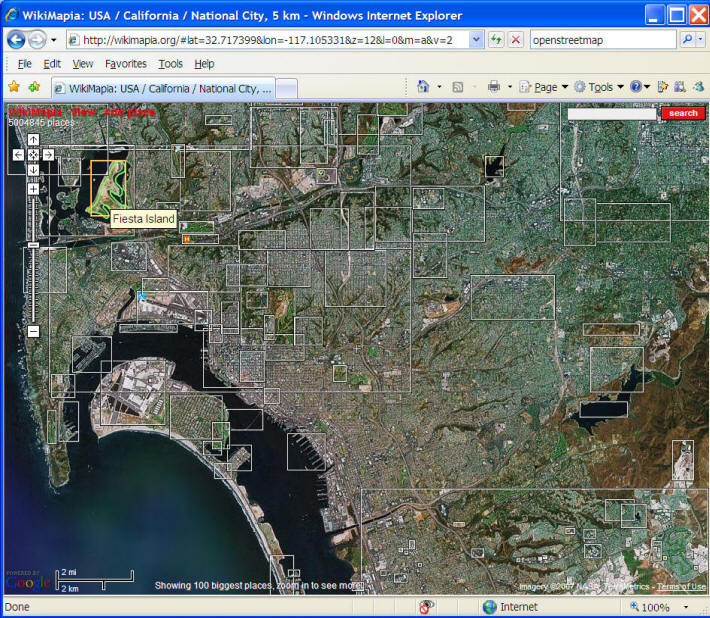
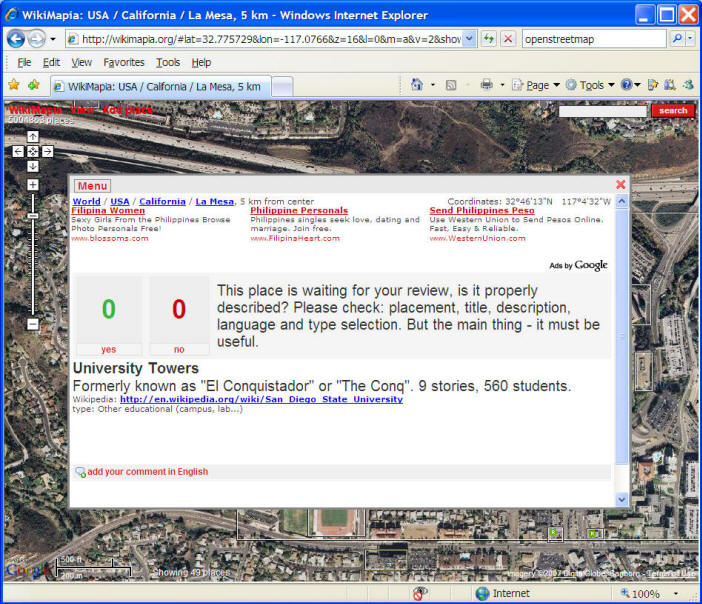
Web-based Collaborative Data INPUT (Participatory GIS).
1. OpenStreetMap http://openstreetmap.com/
2. Wikimapia.org http://wikimapia.org
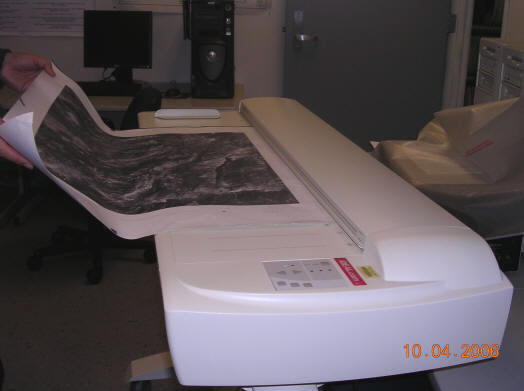
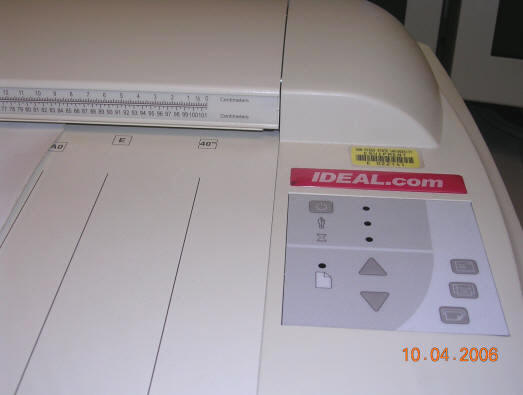
Second-Hand (Secondary) GIS sources: re-scanned images, digitizing maps, digital elevation model.
Secondary GIS data sources are digital and analog datasets that were originally captured in another format (such as papers or films). We will need to convert (by scanning or digitizing) the original format of data into digital GIS data formats.
Re-scanning maps or images (a large-size scanner at the CESAR lab)
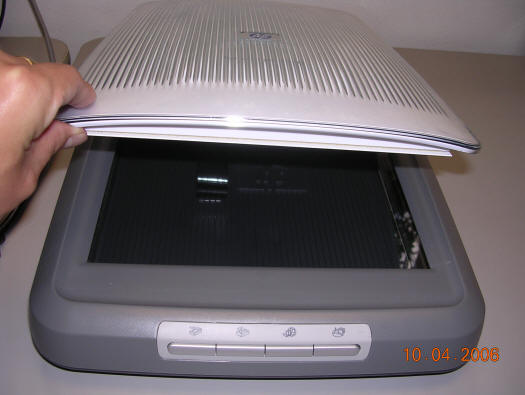
Smaller scanner.
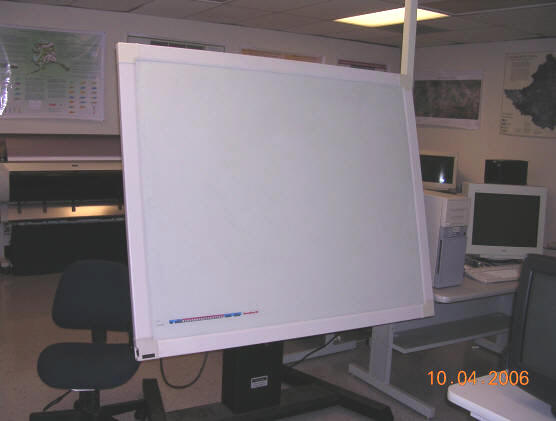
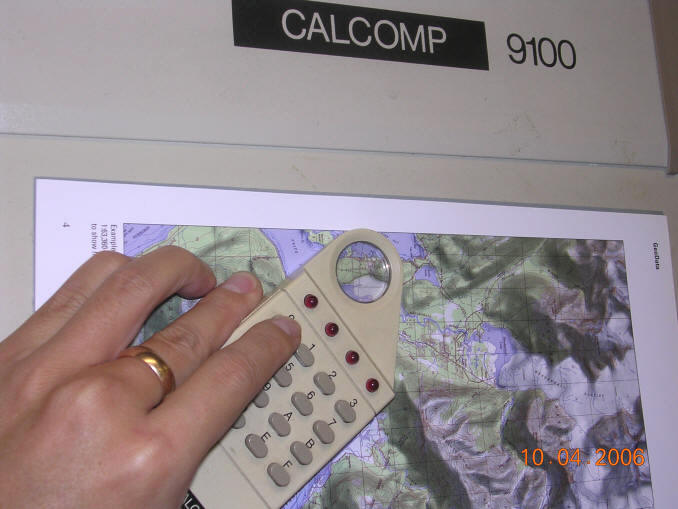
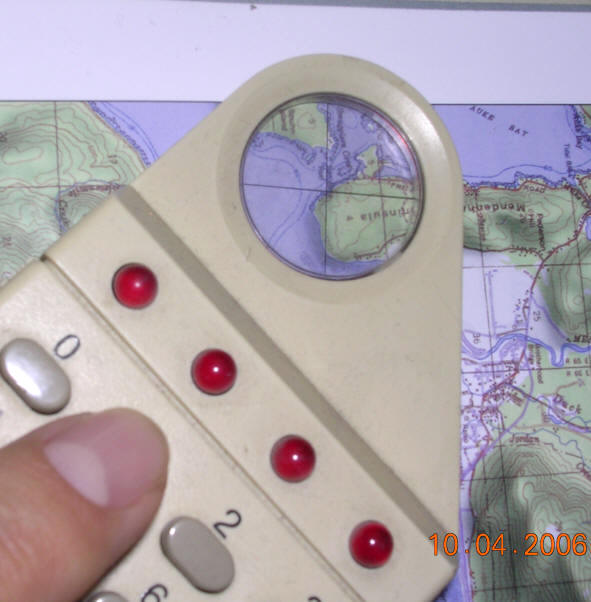
Digitizer.
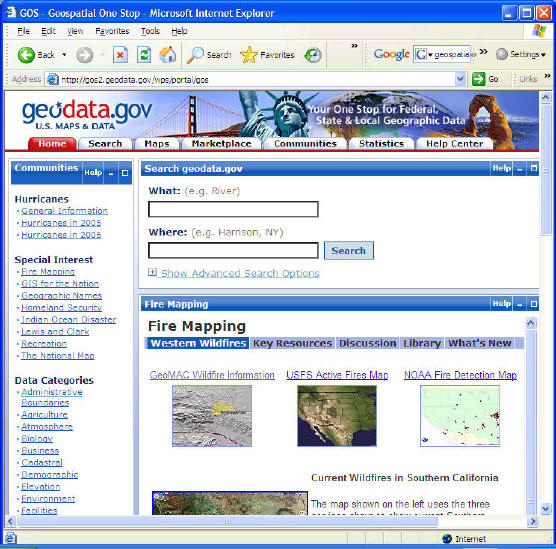
Third-Hand? (Data Sharing) by Spatial Web.
CD-ROM, On-line downloadable datasets.
Data Sampling: (descriptions are from Wikipeida: http://en.wikipedia.org/wiki/Sampling_%28statistics%29 )
Sampling is that part of statistical practice concerned with the selection of individual observations intended to yield some knowledge about a population of concern, especially for the purposes of statistical inference. In particular, results from probability theory and statistical theory are employed to guide practice.
(from Wikipeida: http://en.wikipedia.org/wiki/Sampling_%28statistics%29 )
The sampling process consists of five stages:
Why sampling? (Save money? faster results? Prediction? Accurate? )
Examples: Election sampling results: Candidate A 35% vs. Candidate B. 20% (1000 adults telephone interviews).
Population concerns: Congress Mid-term Election .
sampling frame: Who will you support? A vs. B.
Sampling methods: telephone interviews or on-line survey.
 a random number table.
(In reality, it is very difficult to create a purely "random sample" method).
Using this procedure each element in the population has a known and equal probability of selection. This makes systematic sampling functionally similar to simple random sampling. It is however, much more efficient and much less expensive to do.
(descriptions are from Wikipeida: http://en.wikipedia.org/wiki/Sampling_%28statistics%29 )
Example: Digital Elevation Model (DEM). (30M x 30M)
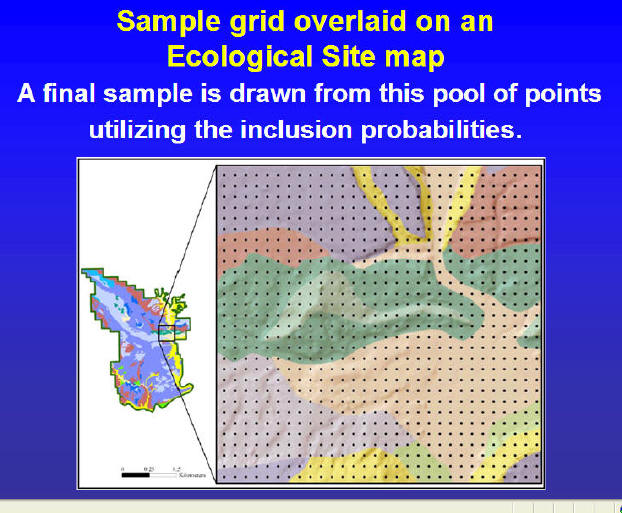
When sub-populations vary considerably, it is advantageous to sample each subpopulation (stratum) independently. Stratification is the process of grouping members of the population into relatively homogeneous subgroups before sampling. The strata should be mutually exclusive : every element in the population must be assigned to only one stratum. The strata should also be collectively exhaustive : no population element can be excluded. Then random or systematic sampling is applied within each stratum. This often improves the representativeness of the sample by reducing sampling error. It can produce a weighted mean that has less variability than the arithmetic mean of a simple random sample of the population.
There are several possible strategies:
A real-world example of using stratified sampling would be for a US political survey. If we wanted the respondents to reflect the diversity of the population of the United States, the researcher would specifically seek to include participants of various minority groups such as race or religion, based on their proportionality to the total population as mentioned above. A stratified survey could thus claim to be more representative of the US population than a survey of simple random sampling or systematic sampling.
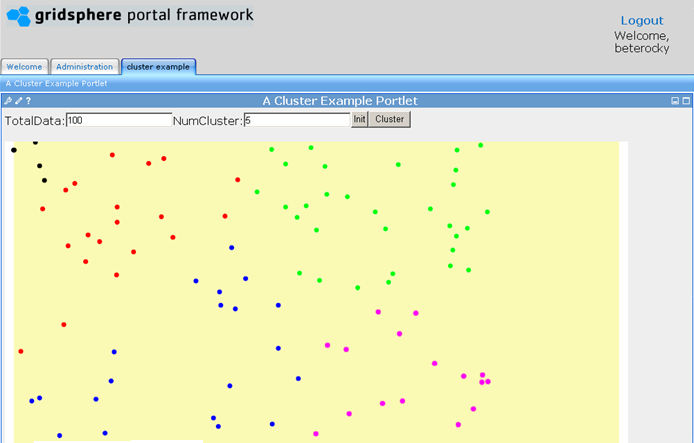
Cluster sampling (descriptions are from Wikipeida: http://en.wikipedia.org/wiki/Sampling_%28statistics%29 ) is a sampling technique used when "natural" groupings are evident in the population. The total population is divided into these groups (or clusters), and a sample of the groups is selected. Then the required information is collected from the elements within each selected group. This may be done for every element in these groups, or a sub sample of elements may be selected within each of these groups.
Each cluster should be a small scale version of the total population. The clusters should be mutually exclusive and collectively exhaustive. A random sampling technique is then used on any relevant clusters to choose which clusters to include in the study. In single-stage cluster sampling, all the elements from each of the selected clusters are used. In two-stage cluster sampling, a random sampling technique is applied to the elements from each of the selected clusters.
One version of cluster sampling is area sampling or geographical cluster sampling. Clusters consist of geographical areas. A geographically dispersed population can be expensive to survey. Greater economy than simple random sampling can be achieved by treating several respondents within a local area as a cluster. It is usually necessary to increase the total sample size to achieve equivalent precision in the estimators, but the savings in cost may make that feasible.
Sampling and data collecting
CNN website example:
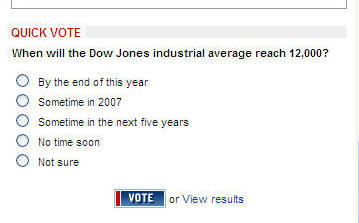
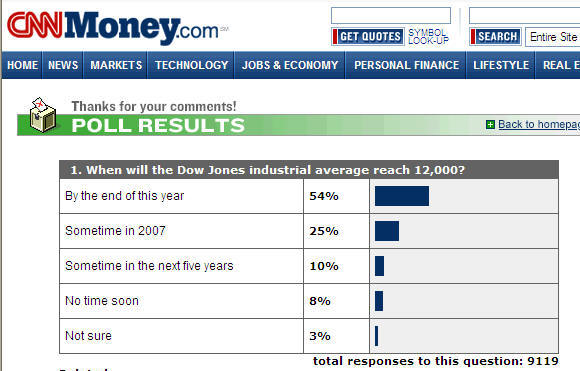
Discussion:
Does the CNN on-line survey is a good sampling method?
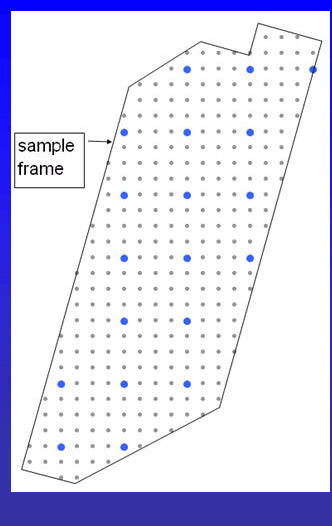
Spatial data sampling:
Simple Random Sampling
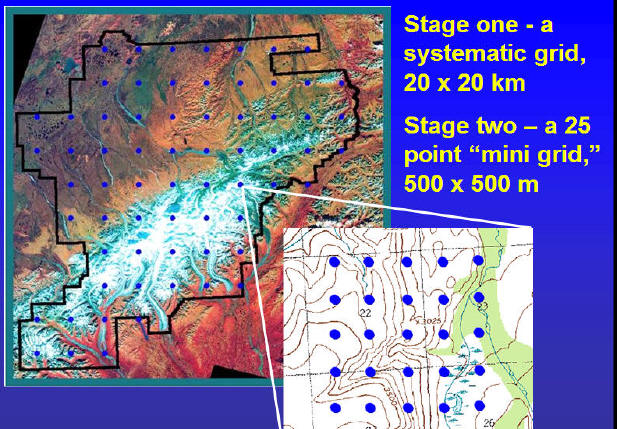
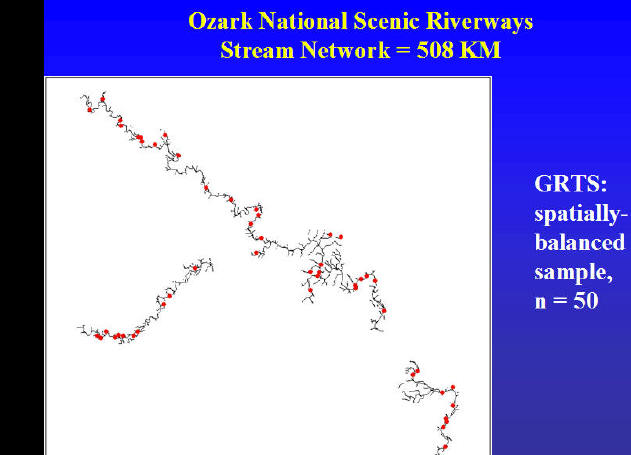
Images from http://science.nature.nps.gov/im/monitor/meetings/Austin_05/LMorrison_SamplingDesign.ppt
Systematic Sampling
Two Stage Cluster Sampling Design
Stratified sampling (For each river and sub-streams)
Temporal sampling design (when and how often to do the sampling?)
(Each Year? Each month? Each weeks? Summer or Winter? -- Seasonal changes).
Data collection workflow:
planning,
preparation,
digitizing/transfer,
editing/improvement and
evaluation.
Two data collection methods: data capture and data transfer.
Data Capture:
Remote Sensing Data: Four resolution aspects: spatial, spectral, radiometric and temporal.
Spatial resolution:
Low resolution example (MODIS 1km)
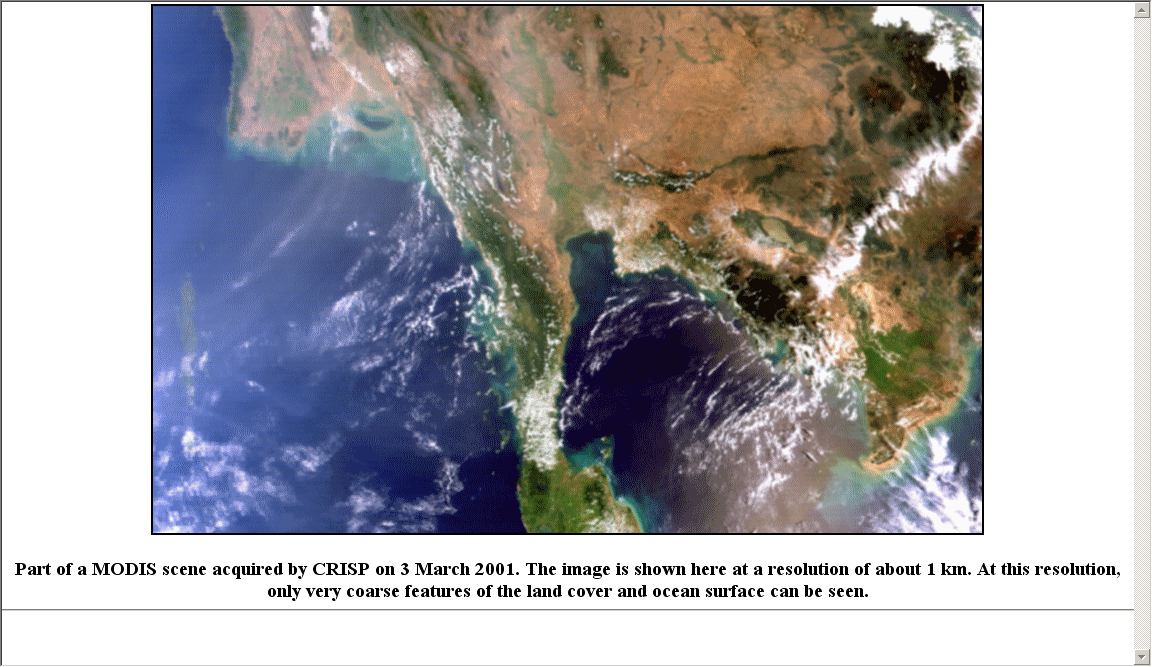
(http://www.crisp.nus.edu.sg/~research/tutorial/modis1.htm)
High resolution (SPOT 20m)
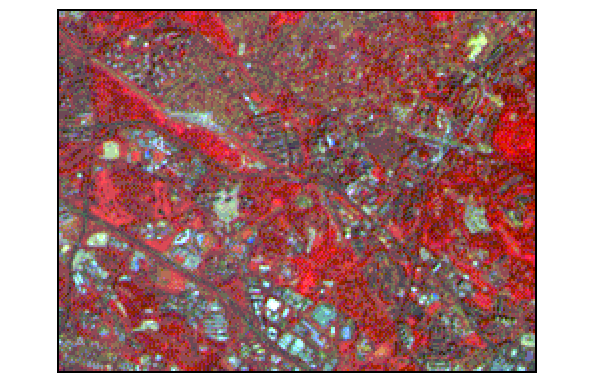
(http://www.crisp.nus.edu.sg/~research/tutorial/image.htm)
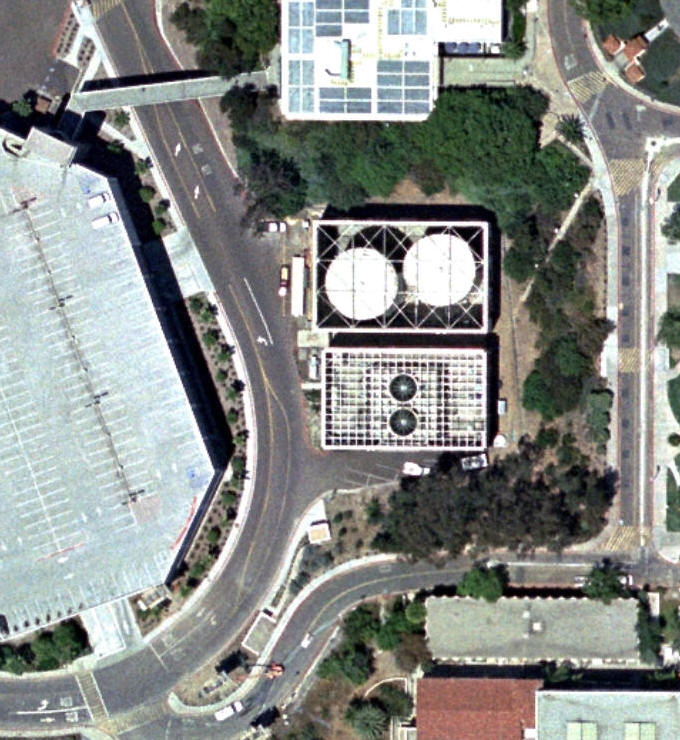
Very high resolution (IKONOS 1m)
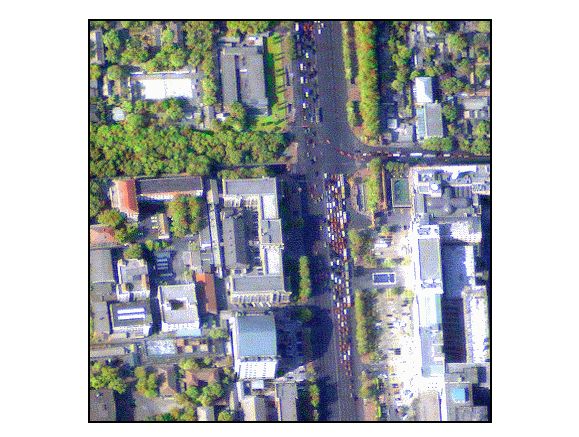
(http://www.crisp.nus.edu.sg/~research/tutorial/image.htm)
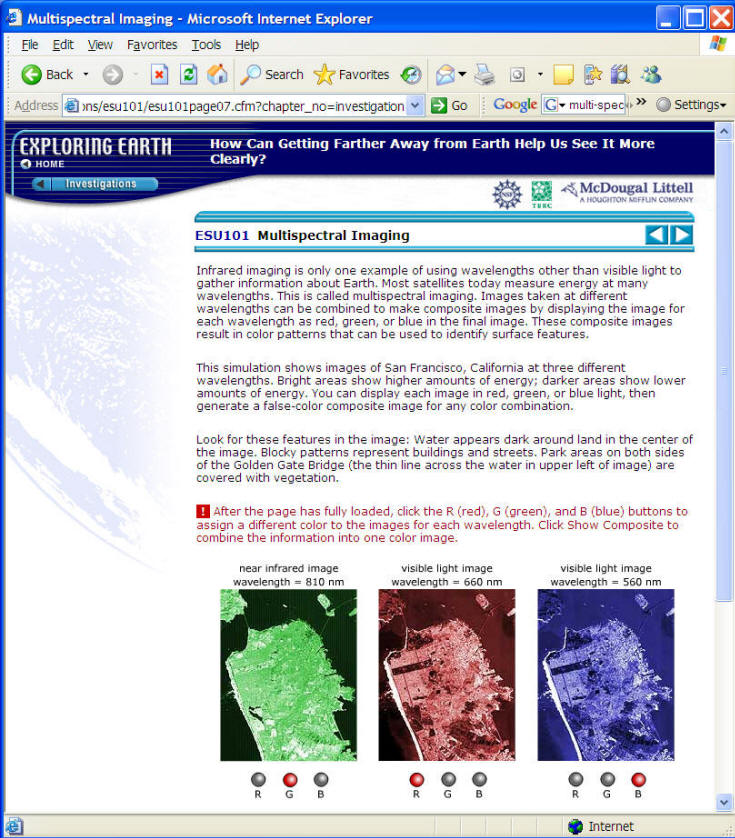
Spectral resolution: (SHOW NASA EMS MOVIE).
Earth surface cover types have their own characteristics to reflect and emit the radiation.
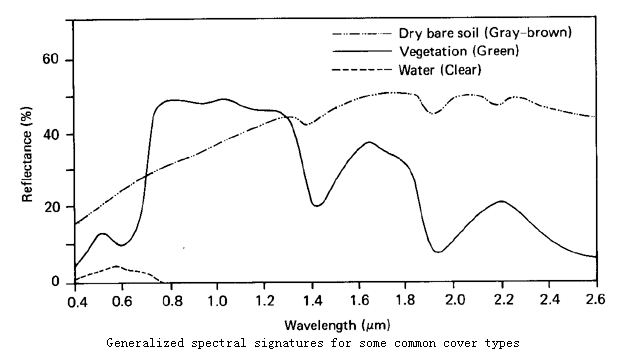
(http://geog.hkbu.edu.hk/virtuallabs/rs/env_backgr_refl.htm)
The concept of band: A particular portion in the entire spectrum.
(http://en.wikipedia.org/wiki/Spectral_band)
Single band,
multi-spectral and
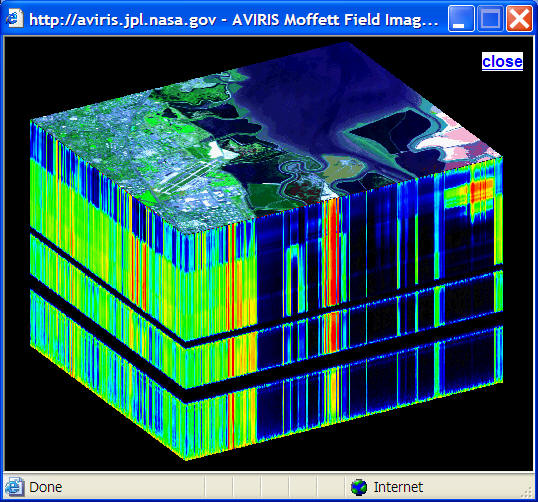
hyperspectral systems (numbers of bands to be captured)
Most current satellites have a broad band spectral resolution. For example, AVIRIS Airborne Visible/Infrared Imaging Spectrometer (from NASA/JPL) has 224 bands,
In addition to remote sensing imagery, aerial photography is useful as well.
SDSU Campus Aerial photos (2005).
Temporal Resolution: (How often to update the information?)
Temporal resolution is related to the time series of images taken from the sky. If the images are taken sparsely in time then the possibility exists that some phenomena will be missed.
The temporal resolution of Landsat is 16 days, FORMOSAT-II is one day, MODIS is every six hours, SPOT is 26 days.
|
|
Radiometric Resolution: Ability of a sensor to distinguish between objects of similar reflectance. -- 2 bits vs. 8 bits vs. 25 bits
Vector Data Capture
Two branches: GPS and surveying.
Surveying: Obtaining accurate locations and relative references for geographic objects.

Discussion: Why we need control points?
Commonly used to produce 3-D Scene:
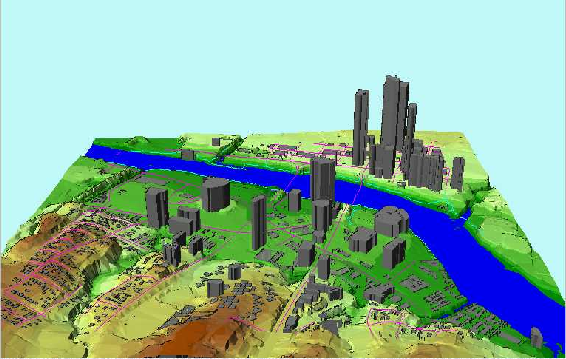
(http://www.ce.utexas.edu/prof/maidment/grad/tate/study/remote/TermProj.html)
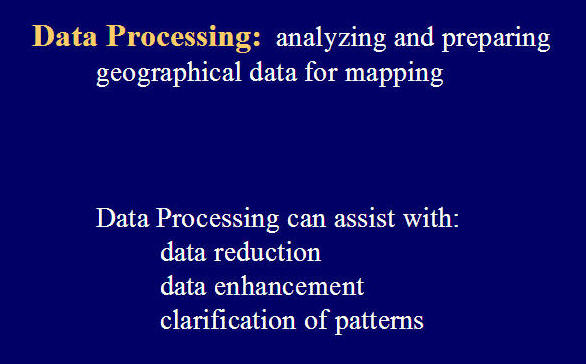
Attribute Data Processing
¡@
Unit-6 In-Class Questions:
1. Please compare the advantages and disadvantages between First-Hand GIS data versus Second-Hand GIS data? Which one is more expensive ? WHY?
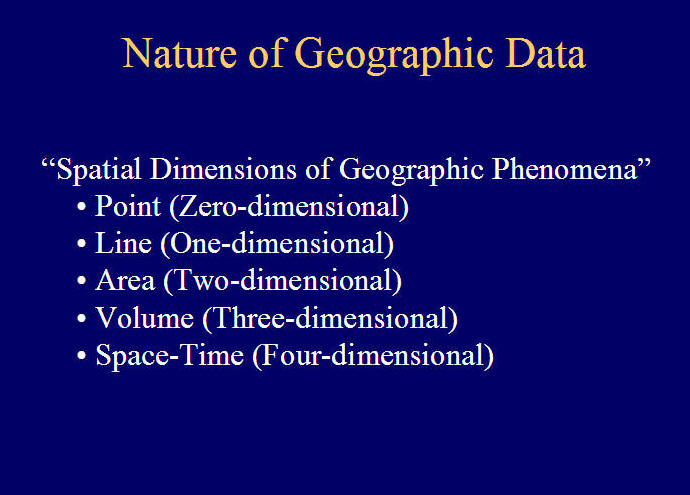
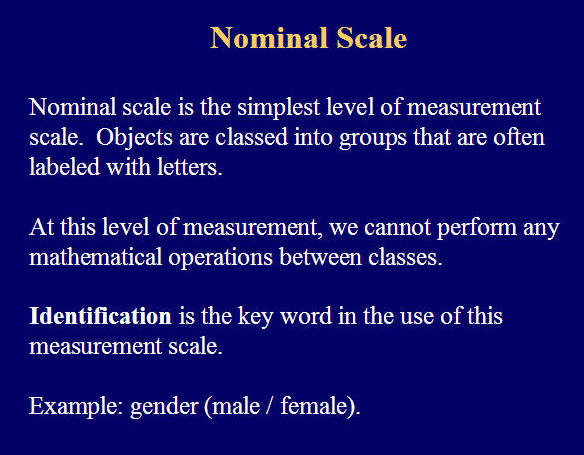
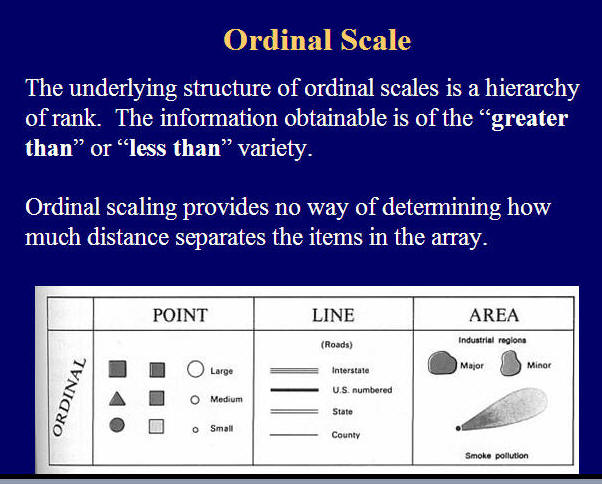
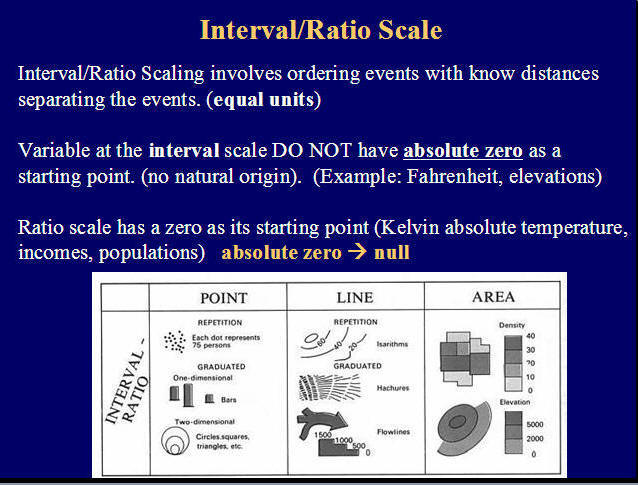
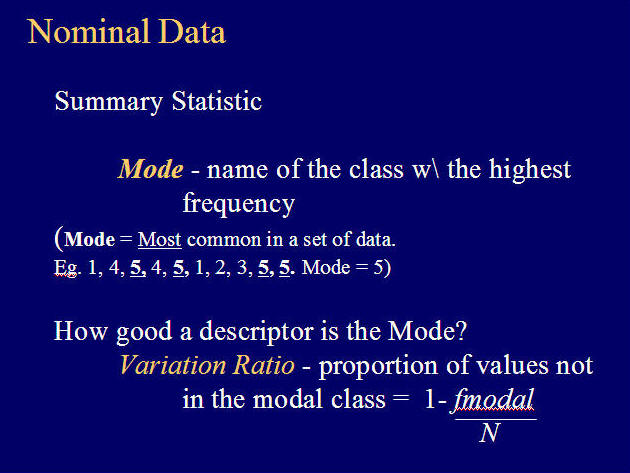
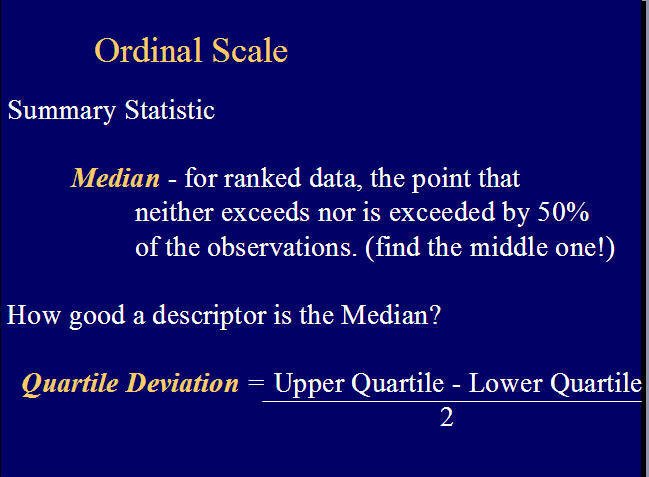
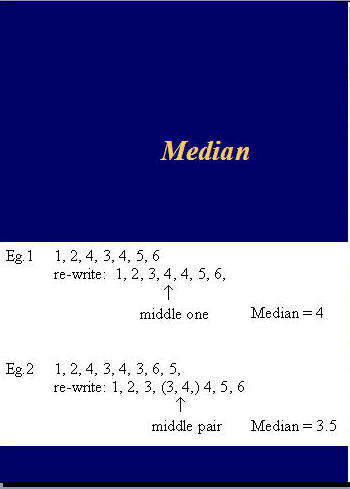
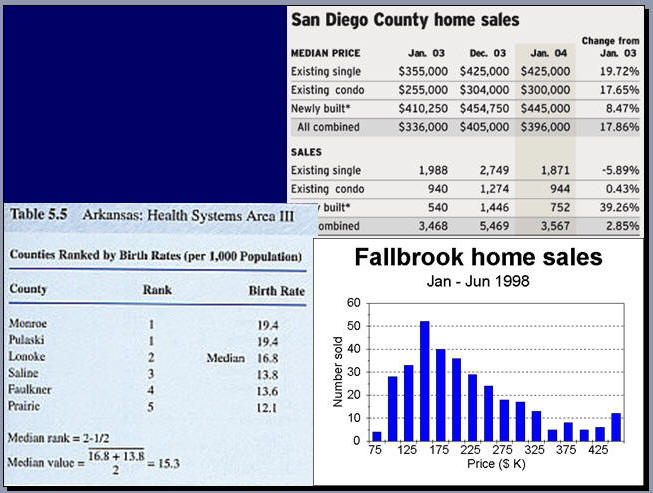
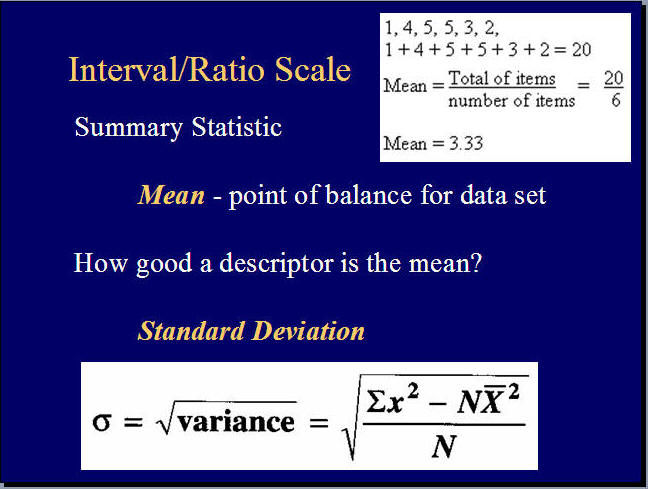
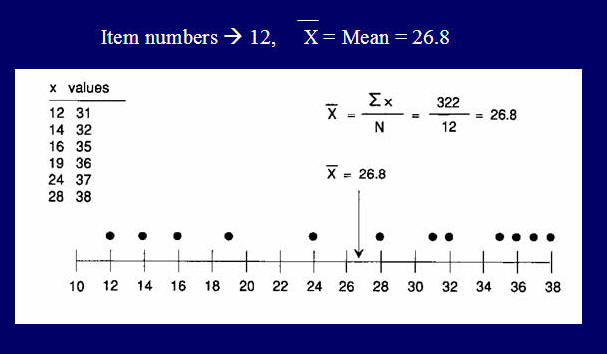
2. Please provide ONE geospatial information example for each Nominal Scale (Data), Ordinal Scale (Data), Interval Scale (Data) and Ratio Scale (Data).
![]()
![]()
![]()
This web site is hosted on MAP.SDSU.EDU
and Geography Department.
|
|