![]()

Geographic Information Science and Spatial Reasoning
(GEOG 104) (A General Education [GE] Course) Spring 2018
![]()
![]()
![]()
|
Geographic Information Science and Spatial Reasoning (GEOG 104) (A General Education [GE] Course) Spring 2018
|
|
| |
|
Geographic Information Science and Spatial Reasoning (GEOG 104) (A General Education [GE] Course) Fall 2015
|
First Web-based GIS exercises: http://map.sdsu.edu/geog104/lab/ex-1/ex-1.htm
(Due day: September 15 before the class 12:30pm. Submit the electronic version in blackboard).
Access the On-line Forum for GEOG104 in
Blackboard:
Blackboard URL:
https://blackboard.sdsu.edu/
Unit 2.1
Mapping the Earth
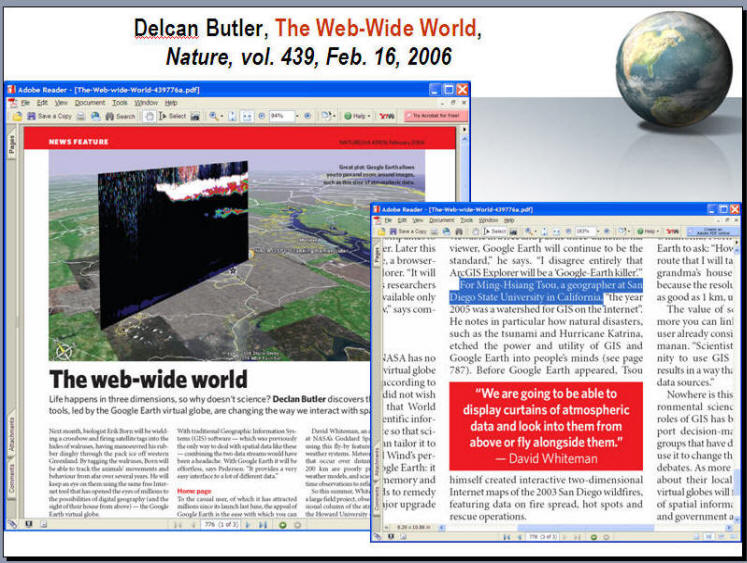
The Article from Nature (Reading Assignment.).
Declan Butler, (2006). The web-wide world. Nature, 439(16). February 2006, pp. 776-778.
Discussion:
What is the most important message you learned from this article?
WHO said "Just as the PC democratized computing, so systems like Google Earth will democratize GIS." in this article? (hint: www.geog.ucsb.edu )
WHO is Jack Dangermond? What's the name of his company? (www.esri.com)
The Concept of Digital Earth
What is the NASA World Wind? http://worldwind.arc.nasa.gov/
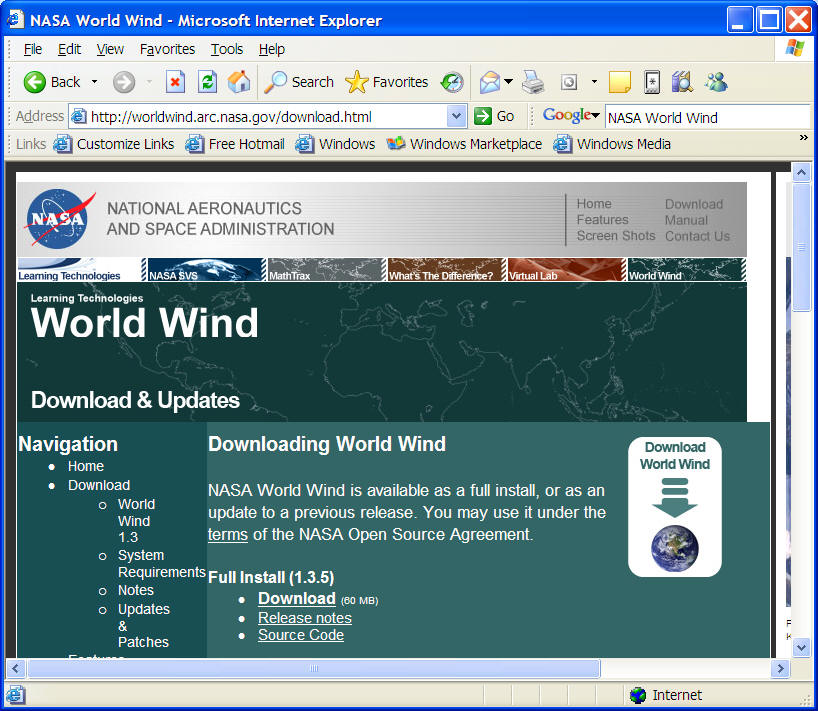
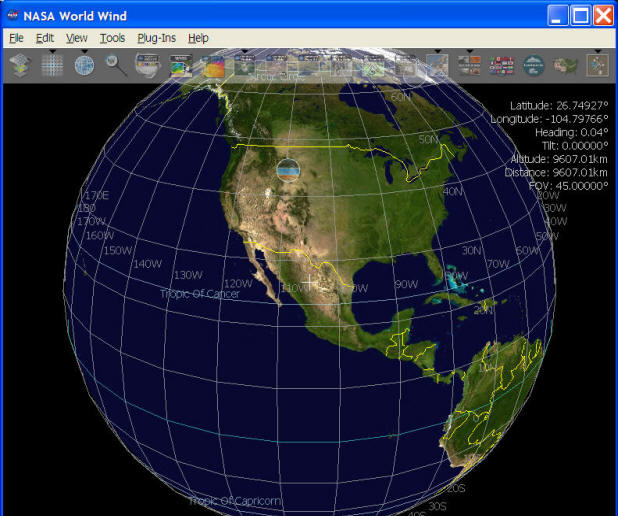
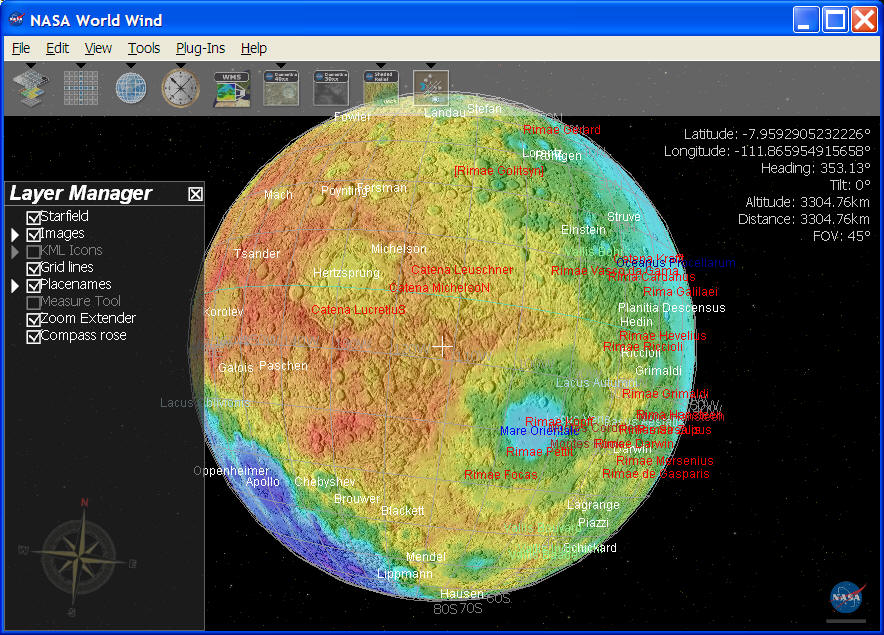
(Where is it?)
(demos of NASA World Wind.....)
The concept of digital earth is formalized from the former Vice President Al Gore of the United States who delivered a speech entitled "The Digital Earth: Understanding our planet in the 21st Century" at California Science Center, Los Angeles, on January 31, 1998. http://www.globe.gov/arc/s2s/archive/digital-earth/msg00080.html
"Imagine, for example, a young child going to a Digital Earth exhibit at a
local museum. After donning a head-mounted display, she sees Earth as it
appears from space. Using a data glove, she zooms in, using higher and
higher levels of resolution, to see continents, then regions, countries,
cities, and finally individual houses, trees, and other natural and man-made
objects. Having found an area of the planet she is interested in exploring,
she takes the equivalent of a "magic carpet ride" through a 3-D
visualization of the terrain. Of course, terrain is only one of the many
kinds of data with which she can interact. Using the systems’ voice
recognition capabilities, she is able to request information on land cover,
distribution of plant and animal species, real-time weather, roads,
political boundaries, and population. She can also visualize the
environmental information that she and other students all over the world
have collected as part of the GLOBE project. This information can be
seamlessly fused with the digital map or terrain data."
(Quote from Al Gore: http://www.globe.gov/arc/s2s/archive/digital-earth/msg00080.html)
More information: http://www.digitalearth-isde.org/society/56
Maps are the representation of our Earth
(or can we map other Planets?)...
Why [Representation]?
By building representations, we humans can assemble far more knowledge about our planet than we ever could as individuals.
(Examples: Mathematics.. abstraction/representation --> 2 + 2 = 4 )
(by building representations, people can share their knowledge with others and accumulate knowledge steps by steps).
What is a map?
(for more information, see GEOG 381 Computerized Map Design http://geography.sdsu.edu/People/Pages/tsou/geog381/ )
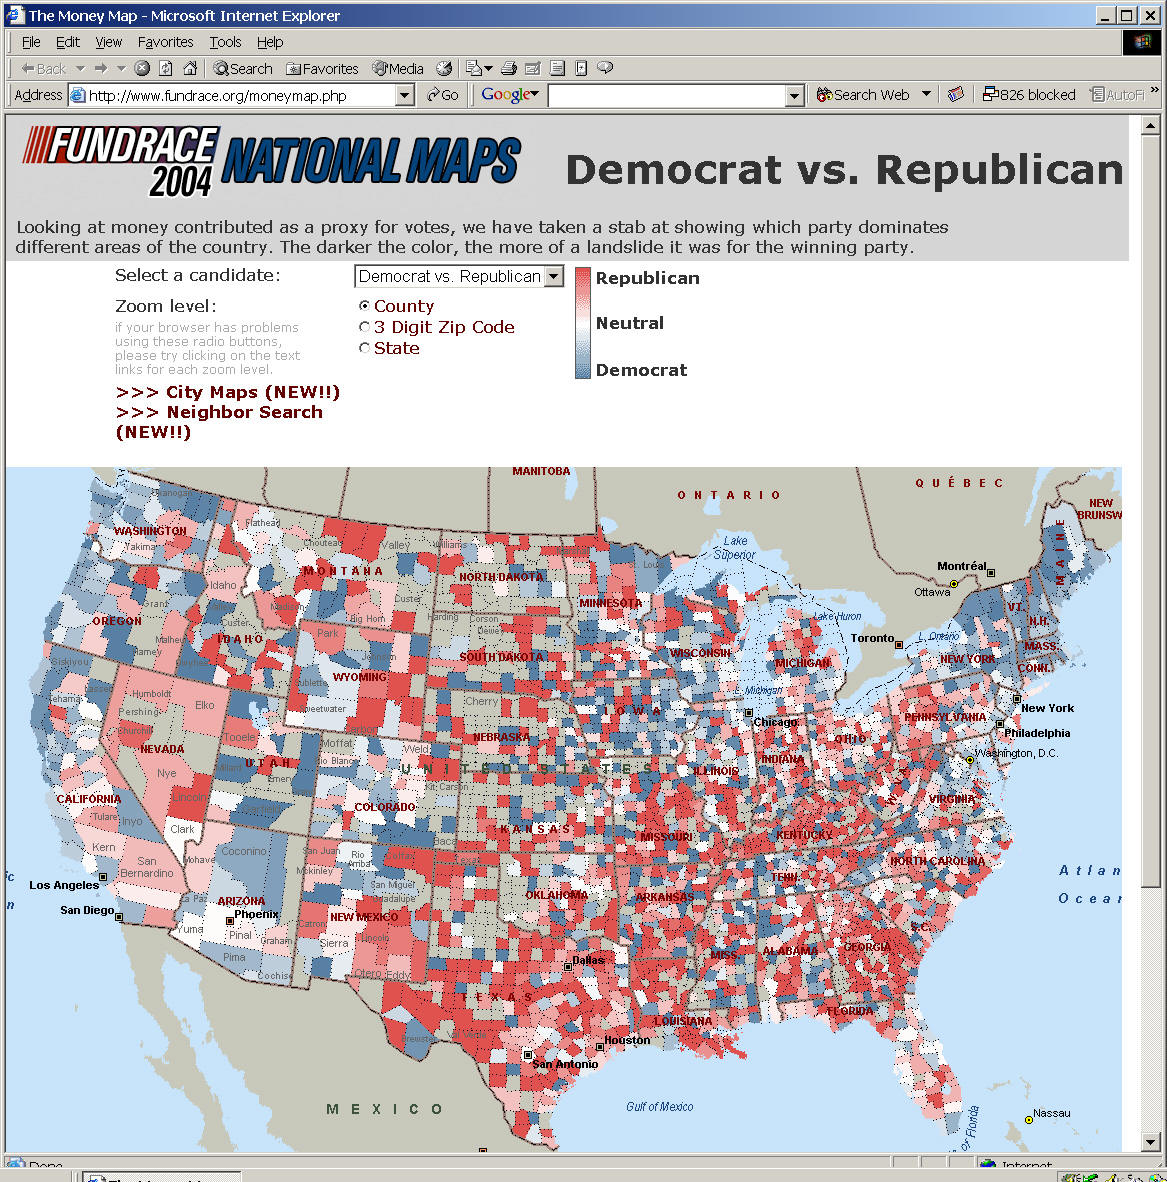
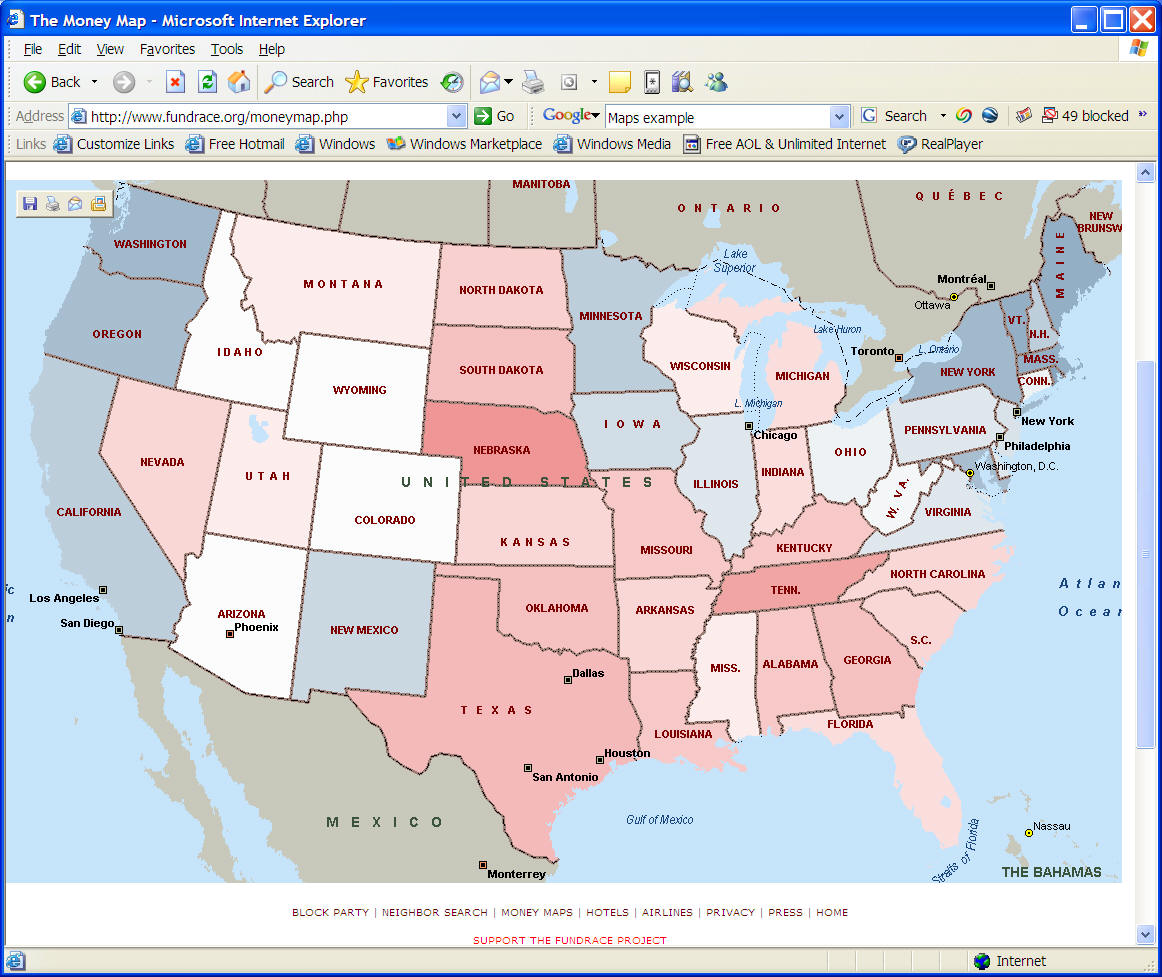
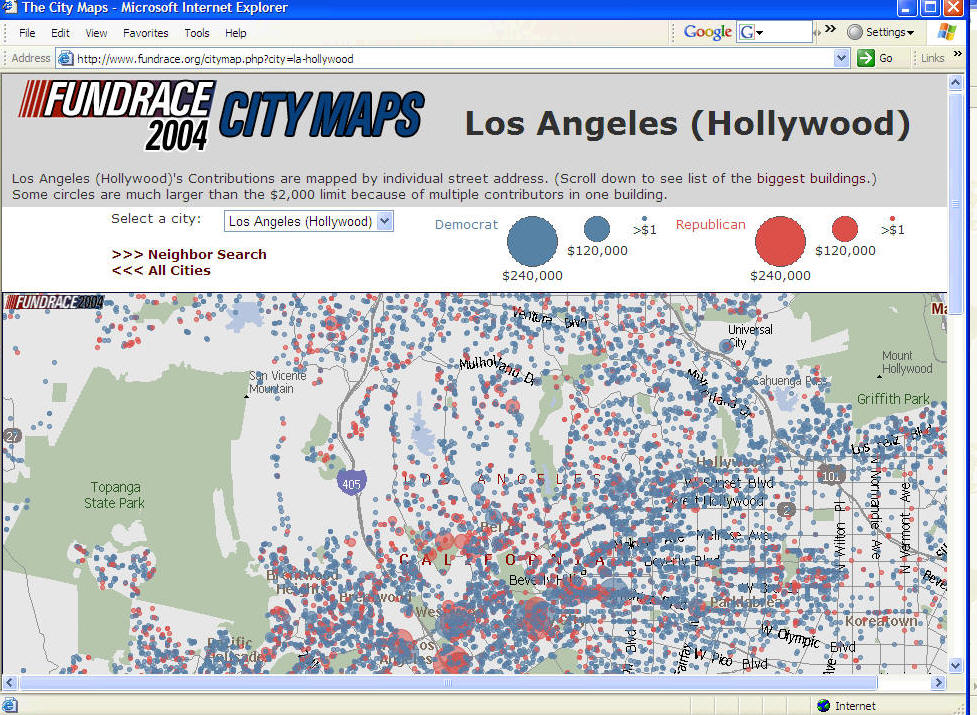
(How many people donate their moneys for political campaign in U.S. ? How can we generalize these information into maps?)
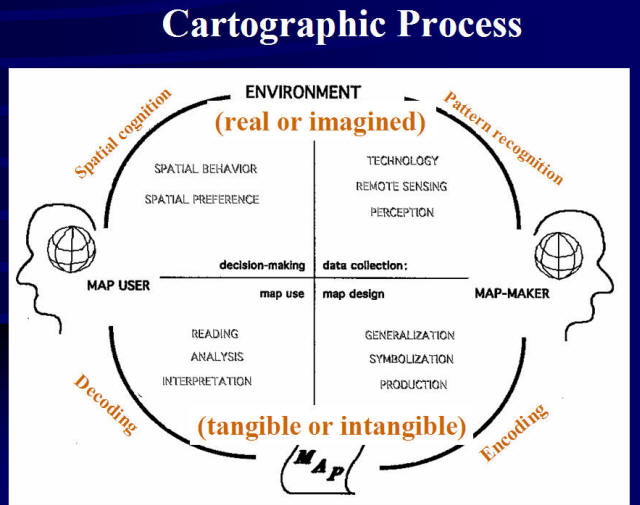
What is Cartography?
Cartography is about maps.
The four steps of cartographic process are:
Modern Cartography is emphasizing on Digital Representation and Computerized Map Design.
Representation in digital form (textbook 3.2).
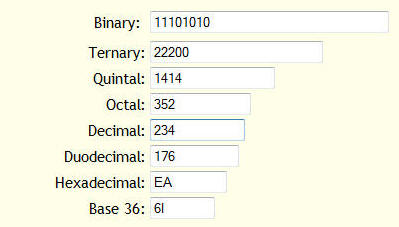
The Foundation of Digital Representation: The Binary Counting System
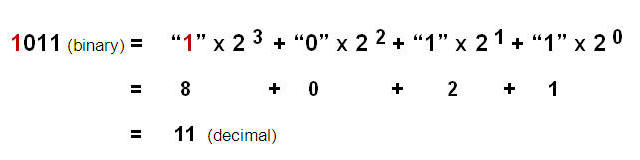
The binary counting system uses only two symbols, 0 and 1, to represent numerical information.
http://en.wikipedia.org/wiki/Binary_numeral_system
Examples: 01101001001 (binary system) = 841 (decimal system)
1111 = 15 (decimal)
0000 = 0 (decimal)
0010 = ?
0011 = ?
More information: http://www.cut-the-knot.org/do_you_know/BinaryHistory.shtml
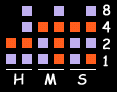
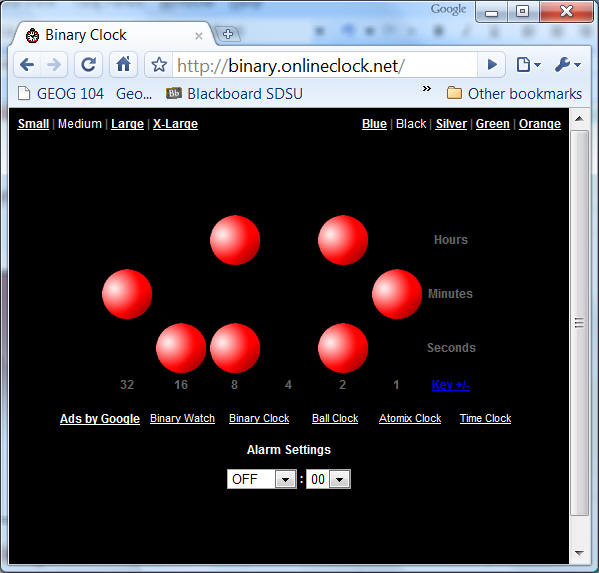
You can buy a "LED binary clock.
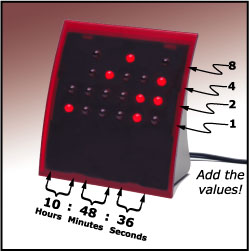
(image source: http://stealthytech.com/ (no longer available now)
What time is it?
http://www.glassgiant.com/geek/binaryclock/
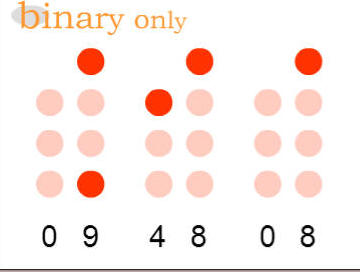
What time is this clock? (different format).
http://binary.onlineclock.net/ (or watch it online). (Another different format).
Additional Resources (YouTube Tutorials):
https://www.youtube.com/watch?v=_97OwCkjh3c
https://www.youtube.com/watch?v=5sS7w-CMHkU
https://www.youtube.com/watch?v=4EJay-6Bioo
https://www.youtube.com/watch?v=qWxiXU02ZQM
(Tools to convert between Decimal systems and Binary systems)
http://www.cut-the-knot.org/binary.shtml
In a computer, the binary number systems was used for storing variables.
█ = one bit system (possible value : 0 or 1)
█ █ = two bits system (possible value: 00, 01, 10, 11) = decimal value (0, 1, 2, 3)
█ █ █ █ = four bits system = possible value : 0000 -- 1111 (from 0 to 15) = 16 different values
█ █ █ █ █ █ █ █ = 8 bits = ONE BYTE (byte) = 00000000 - 11111111 (from 0 - 255)
This is the most common values range from a computer system, such as color arrangement, IP address:
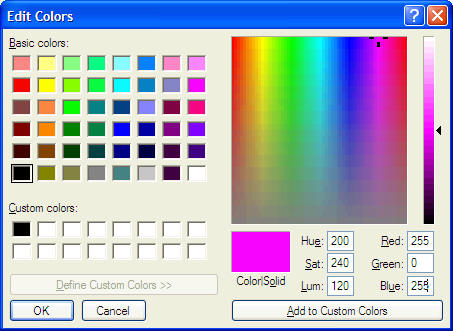
Microsoft Painter Example.
hexadecimal system, or simply hex, is a numeral system with a radix or base of 16 usually written using the symbols 0-9 and A-F or a-f. ( http://en.wikipedia.org/wiki/Hexadecimal )
| Hex | Bin | Dec |
|---|---|---|
| 0 | 0000 | 0 |
| 1 | 0001 | 1 |
| 2 | 0010 | 2 |
| 3 | 0011 | 3 |
| 4 | 0100 | 4 |
| 5 | 0101 | 5 |
| 6 | 0110 | 6 |
| 7 | 0111 | 7 |
| 8 | 1000 | 8 |
| 9 | 1001 | 9 |
| A | 1010 | 10 |
| B | 1011 | 11 |
| C | 1100 | 12 |
| D | 1101 | 13 |
| E | 1110 | 14 |
| F | 1111 | 15 |
Example: 0F (hex systems) = 15 (decimal systems)
1A (Hex systems) = 16 (1) + 10 (A) = 26 (decimal systems).
11 (Hex systems) = 16 + 1 = 17 (decimal systems).
FFFF = 1111111111111111 (binary = 16 bits = two bytes)
█ █ (hex system) = 8 bits = one byte
Web page color systems (HTML) use Hex systems for color mapping
█ █ █ █ █ █ (R, G, B)
Blue = 00,00,FF
| Color | Hexadecimal | Color | Hexadecimal | Color | Hexadecimal | Color | Hexadecimal |
|---|---|---|---|---|---|---|---|
| aqua | #00ffff | black | #000000 | blue | #0000ff | fuchsia | #ff00ff |
| gray | #808080 | green | #008000 | lime | #00ff00 | maroon | #800000 |
| navy | #000080 | olive | #808000 | purple | #800080 | red | #ff0000 |
| silver | #c0c0c0 | teal | #008080 | white | #ffffff | yellow | #ffff00 |
Example in HTML page :
http://map.sdsu.edu/geog104/index.html
| <font size="4" color="#FF0000" face="Arial">(GEOG 104) (A General Education [GE] Course)</font></span></strong></p> | |
http://www.utexas.edu/learn/html/colors.html
ASCII code (American Standard Code for Information Interchange). (7 bits code, vs. 8 bits code) http://en.wikipedia.org/wiki/ASCII
|
|
On-line converter = http://www.mikezilla.com/exp0012.html
(Try to enter [Hello] in the Google Search Engine. What happen?) www.google.com
Another Coding system: Unicode is an industry standard designed to allow text and symbols from all of the writing systems of the world to be consistently represented and manipulated by computers.
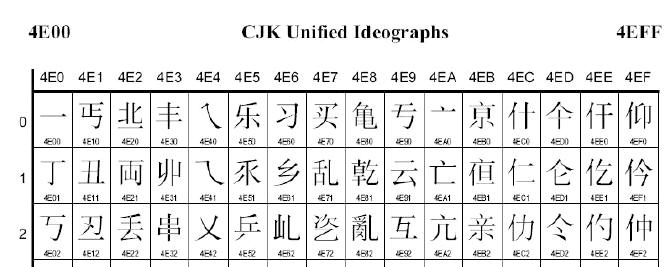
http://en.wikipedia.org/wiki/List_of_CJK_Unified_Ideographs_(4E00-62FF) (then switch the encoding method in your web browser. What happen?)
Different number/storage systems in computers:
Java Language Examples
GIS examples: (source: http://srmwww.gov.bc.ca/gis/storageprecision.html)
ESRI ARC/INFO.
"Long Integers: long (32-bit) integers, using a fixed Unit of Resolution (typically centimeters or millimeters). Long integers store numbers from -2,147,483,648 to 2,147,483,647 preserving 9 decimal digits of precision. " (cited from http://srmwww.gov.bc.ca/gis/storageprecision.html)
"In a GIS databases, there is two choices for the storage of data files. You can choose single-precision (32-bit), or double-precision (64-bit) floating-point numbers. Double precision requires twice the storage space, but carries more precision. Typically, double precision preserves about 18 decimal digits, while single precision preserves about 9." (cited from http://srmwww.gov.bc.ca/gis/storageprecision.html)
When you convert a GIS database from a double-precision system to a single-precision system. What happen?
CPU and O.S. design: from 32 Bits to 64 bits. (increase the Traffic Capacity from 4 lanes road to 8 lanes highway).
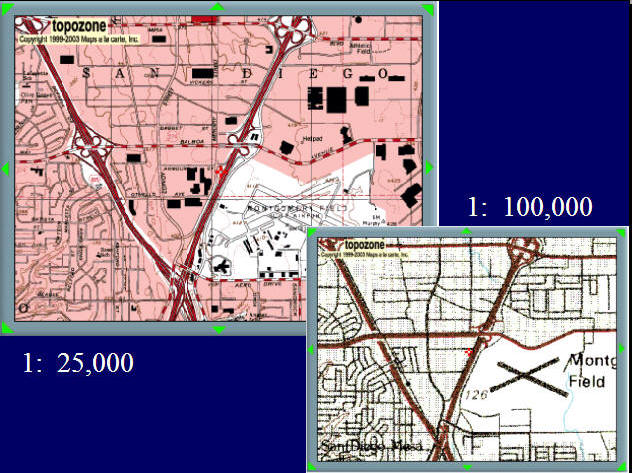
Analog Map Representation vs. Digital Map Representation
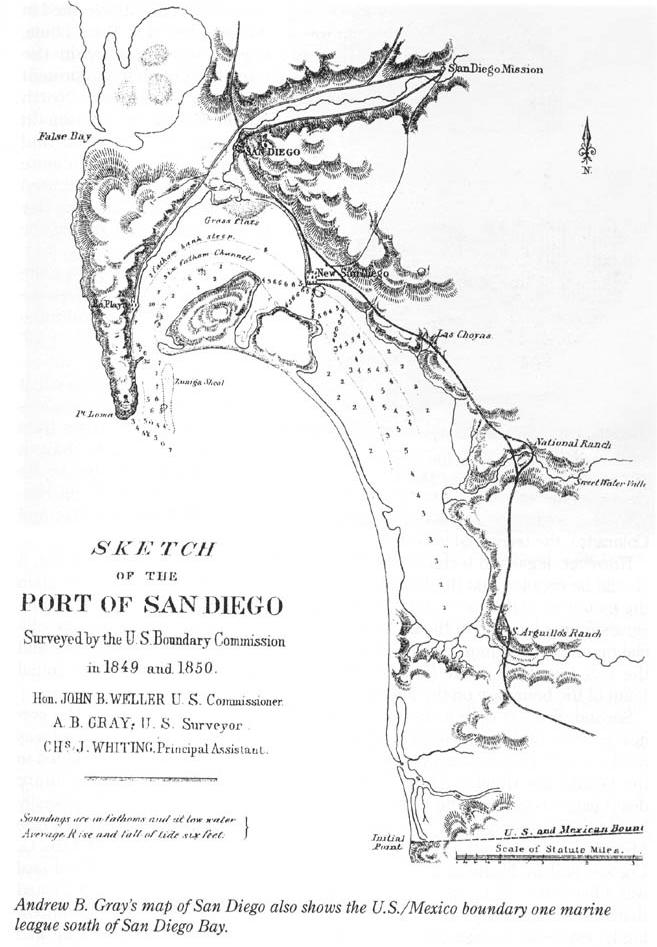
San Diego Maps (1850)
from
The Journal of San
Diego History Spring/Summer 2000, Volume 46, Number 2-3
The Pantoja Map of 1782 and the Port of San Diego: Some Answers Regarding the
International Boundary in the San Diego-Tijuana Region by
Jorge A. Vargas
http://www.sandiegohistory.org/journal/2000-2/pantojaphotos.htm
(Analog Representation -- Hand Drawing)
Digital Representation (from a Satellite Imagery)
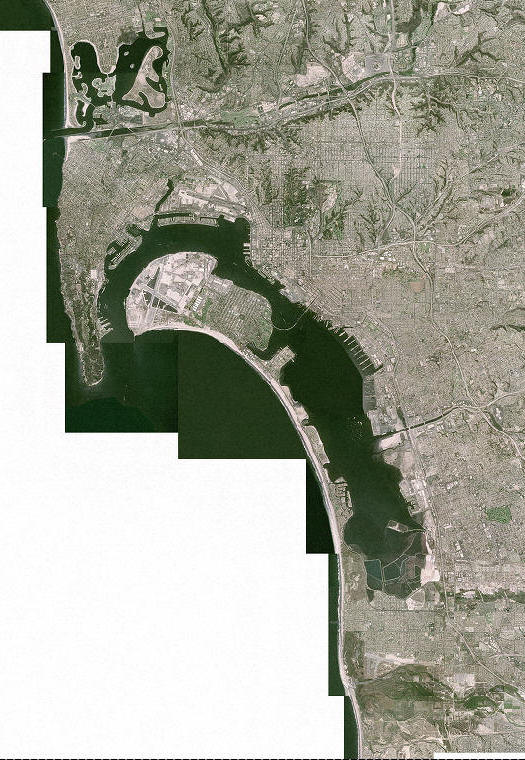
San Diego Historical Map compare to the 2002 Aerial Photos (San Diego).
The advantages of digital map representation (comparing to analog maps):
The disadvantages:
The First Law of Geography: Everything is related to everything else, but near things are more related than distant things. (Waldo Tobler, 1970).
http://en.wikipedia.org/wiki/First_law_of_geography
Examples:
What happen when you can buy items from online? (Amazon. COM).? Does the first law of Geography still be valid? (invisible: Shipping costs).
GIS examples: Spatial interpolation technique.
E.g. Kriging interpolation methods.
http://skagit.meas.ncsu.edu/~helena/gmslab/interp/F1d.gif
http://skagit.meas.ncsu.edu/~helena/gmslab/ (image source),
The first law’s influence on the development of GIS (basis for geo-statistics and spatial analysis).
Geographic data link place, time, and attributes.
Unit 2.2.
How to represent geographic objects?
Conceptual View:
Discrete Objects and Continuous Fields (section 3.5)
Discrete Objects: represent the geographic world as objects with well-defined boundaries in otherwise empty space:
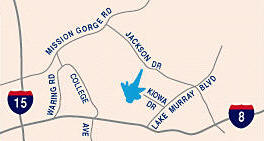
Examples: Lake Murray (polygons), Highway I-8 (lines),
Continuous Fields view represents the real world as a finite number of variables, each one defines at every possible position.
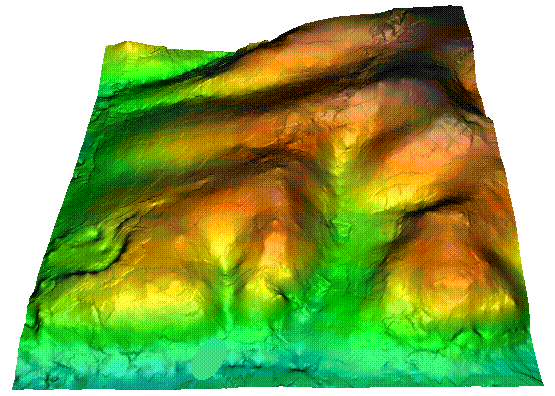
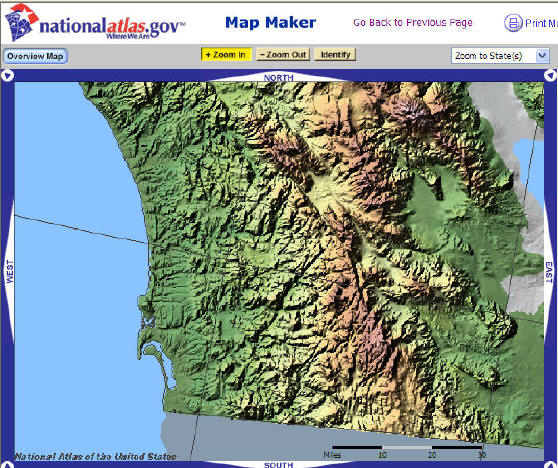
Examples: Elevations: http://nationalatlas.gov
Data Format View in digital computers:
Spatial data have some fundamental properties.
Scale;
Measurement;
Large data volume;
Spatial-temporal dependency
Error-prone;
Topological relations;
Raster and Vector
Data Format: Rasters and vectors (3.6).
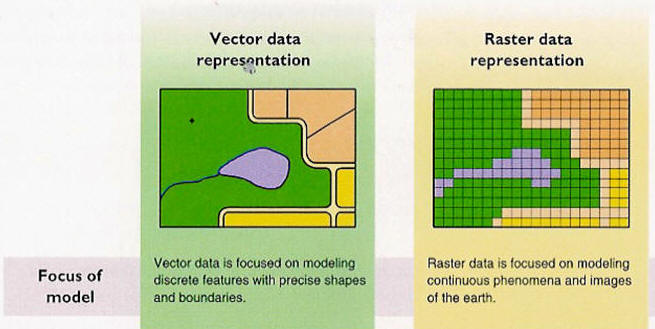
(image source: ESRI published book: Modeling Our World. http://gis.esri.com/esripress/display/index.cfm?fuseaction=display&websiteID=27&moduleID=0
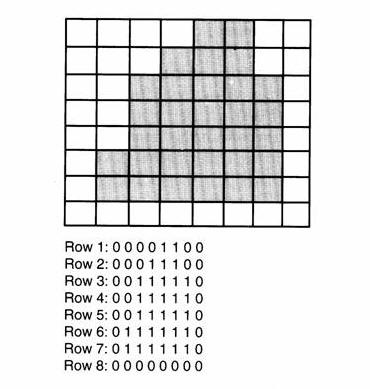
Raster format divides the world into arrays of cells and assign attributes (value) to each cell.
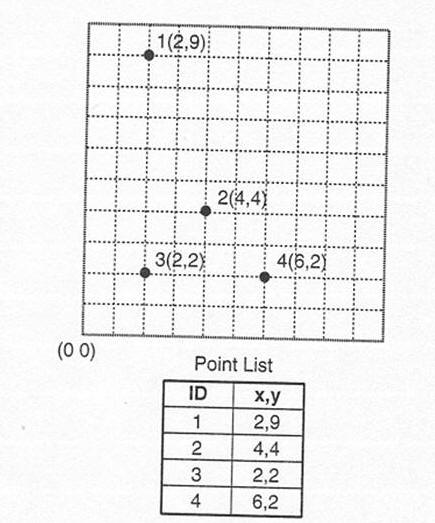
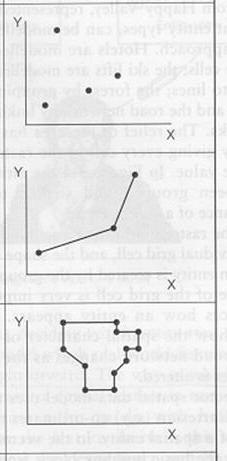
In vector representation, all items can be classified as points, lines, polygons, and 3D volume in a vector-based coordinate system.
All lines are captured as points connected by precisely straight lines.
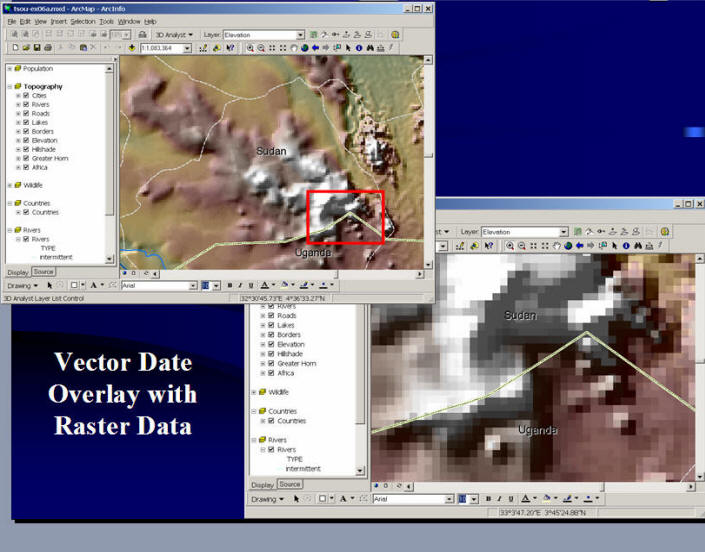
Map overlay example with RASTER data and VECTOR data.
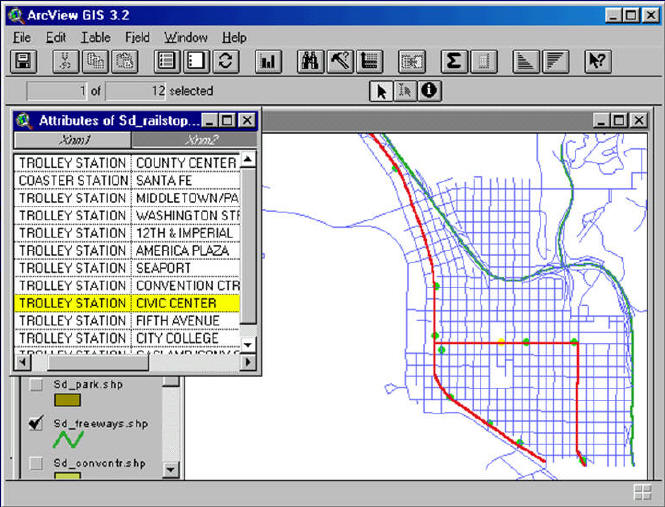
Vector Data example: San Diego Trolley lines. (features -- lines with attributes)
Discuss the vector data and raster data in Google Map. (Map view vs. Satellite View)
The advantages and disadvantages of vector data and rater data.
Limitations and extensions of current representations (May Yuan et al. 2004 *).
l Representing volumetric and temporal objects;
l Representing heterogeneous data at different scales;
l Representing dynamic processes;
l Representing data uncertainty.
* Yuan, M., Mark, D., Egenhofer, M., and Peuquet, D. (2004). Extensions to Geographic Representation: A Research Agenda for Geographic Information Science. Chapter 5 in R. McMaster and L. Usery (eds.), Research Challenges in Geographic Information Science CRC Press, Boca Raton, FL, pp. 129-156, 2004.
Visualization and Animation Maps.
Many animation examples can be found from the textbook's website: http://www.prenhall.com/slocum/ (Slocum et. al. 2003).
(San Diego Wildfire Animation, Animated GIFs)
Alan MacEachen: three more visual variables:
Display date: when the display change starts to initiate.. (U. S. population growth animation) Examples:
http://www.outragegis.com/animations/population-growth.htm
Frequency (temporal texture) is the number of identifiable states per unit time. (similar to rate of changes, but this one highlights the "frequency" rather than "changes". How "smooth" or "fast" does the animation display? Examples: IBM's Deep Thunder project: http://www.research.ibm.com/weather/DT.html
Synchronization is the temporal correspondence of two or more time series. (San Diego wildfire vs. Wind direction)
(MacEachren, A.M. and D. DiBiase. 1991. Animated Maps of Aggregate Data: Conceptual and Practical Problems. Cartography and Geographic Information Systems 18:4, pp. 221-229.)
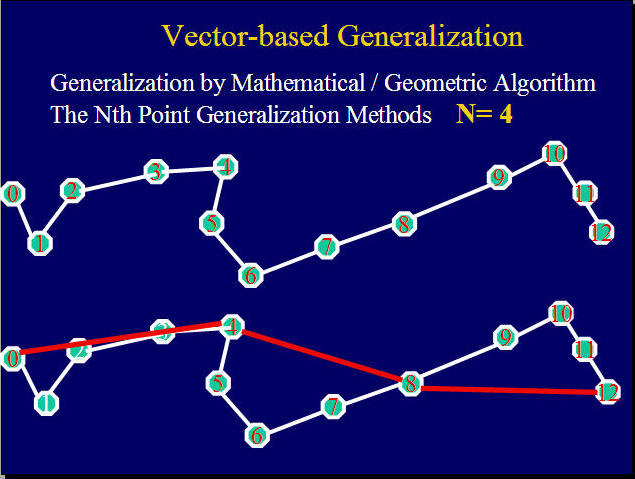
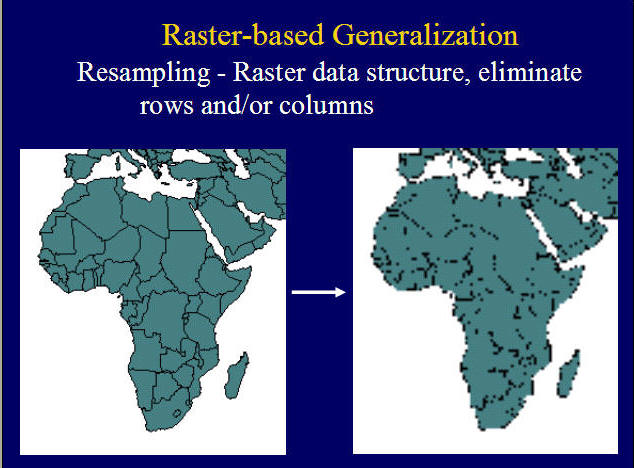
Generalization (text book: 3.8).
The concept of map generalization.
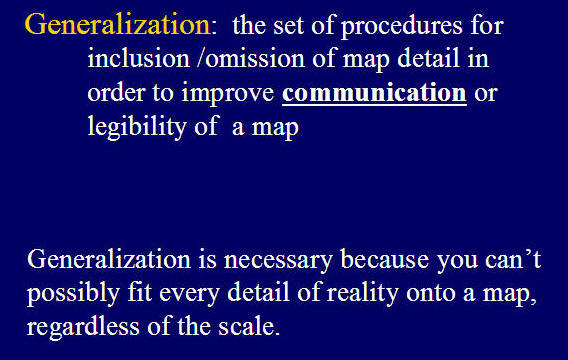
Question: If the high-resolution remote sensing technologies continue to develop, do we still need map generalization?
b
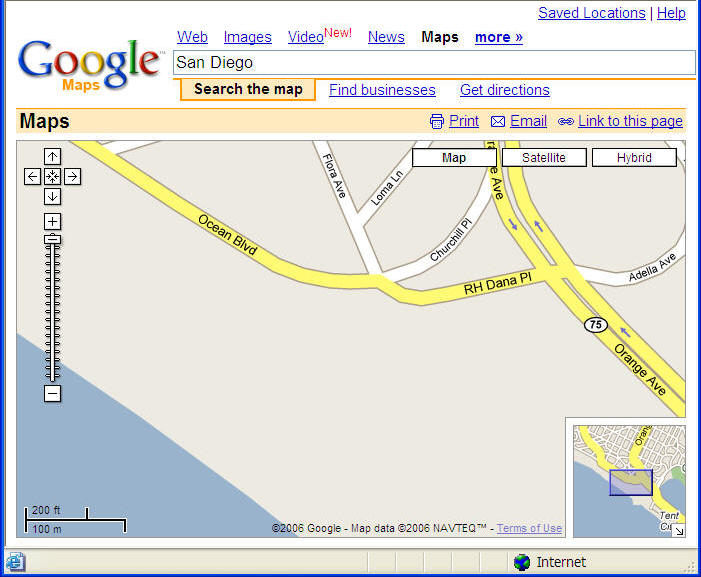
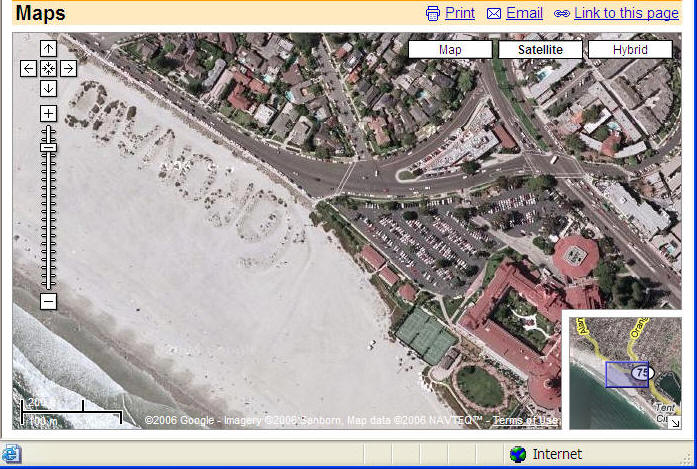
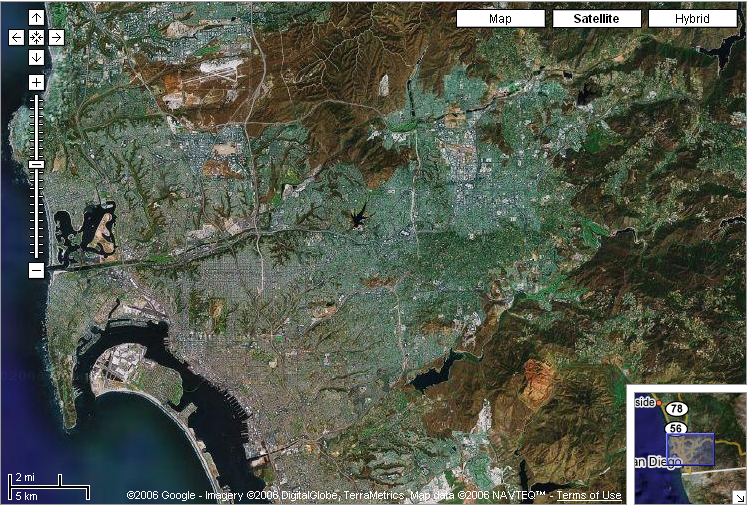
Compare the three Google maps at different scales to point out the examples of
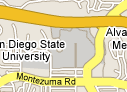
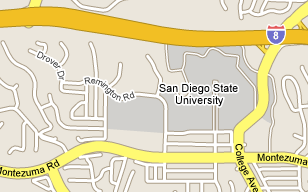
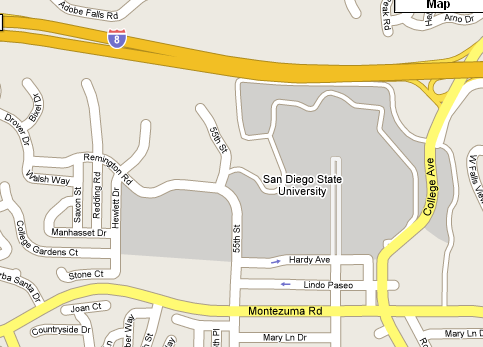
Class Participation Questions: (prepare to share your answers in the beginning of next session).
Describe one real world example for Raster Data Format (such as TV screen, digital photos, LCD screen, web pictures, etc.) and one real world example for the Vector Data Format ( CAD drawing, True type fonts, Blue-prints, etc.). What is the file size of your data example? (10MB? 40KB? or 3GB?) (If you don't know the exact data size, you can just provide your own estimated file size).
Which data format is better for archiving geospatial information? Vector or Raster? Why?
![]()
![]()
![]()
This web site is hosted on MAP.SDSU.EDU
and Geography Department.
|
|