![]() Exercise 6
Exercise 6
Geographic Information Science and Spatial Reasoning
(GEOG 104) #16203 (General Education [GE] Level Course)
![]()
![]()
![]()
|
Geographic Information Science and Spatial Reasoning (GEOG 104) #16203 (General Education [GE] Level Course)
|
Web-based Exercise #5:
Remote Sensing and Image Analysis.
Grading: 10 points total.
Learning Goal: This exercise will introduce several typical remote sensing analysis examples. Though this exercise, the students should be aware of the usefulness of remote sensing technologies in Geographic Information Systems.
Platforms: PC, Mac, or UNIX.
|
Due Day: Dec 03, 2013 (Tuesday) -- at the beginning of lecture (11:00 am). You should upload your lab answers to the Blackboard ( http://blackboard.sdsu.edu ) before the lecture. We will use the Timestamp on your documents in the Blackboard to check if your assignment is late or not.
|
Remote Sensing Image Analytical Tools
Visit the online image analytical tools at http://map.sdsu.edu/arc/Analytical_tools.htm (figure 1).
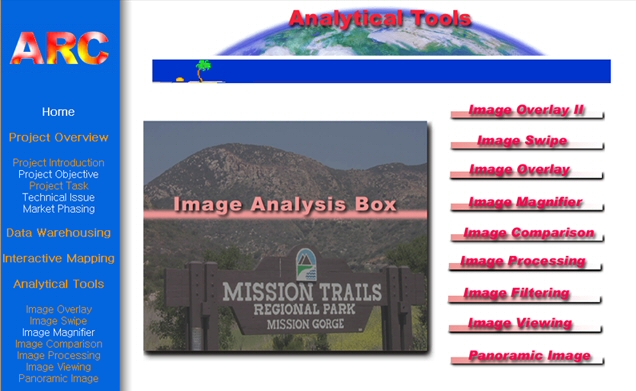
Figure 1: Image Analytical Tools
These tools were developed by the Department of Geography, San Diego State University as part of the NASA ARC project. For further information, please refer to http://map.sdsu.edu/arc/project_intro1.htm#.
The online analytical tools include a number of Java Applets which are embedded into HTML documents. These Applets make an Image Analysis Box. Users can simply click on the buttons in the right of the web page to access the functions. These functions include Image Overlay-I, Image Overlay-II, Image Swipe, Image Magnifier, Image Comparison, Image Processing, Image Filtering, Image Viewing, and Panoramic Image.
Before you proceed, please read through the introduction of the images used in this tool box.
In http://map.sdsu.edu/arc/Analytical_tools.htm, underneath the Image Analysis Box, a brief introduction of several types of imagery is presented. After reading through the introduction, use Google search engine to find related information about ADAR, IKONOS, and Landsat images, answer the question 1.
Since these Java Applets were developed in 2003, some web browsers might show up warning messages as the following:
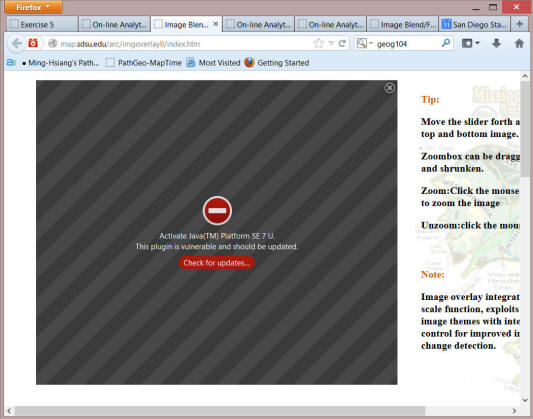
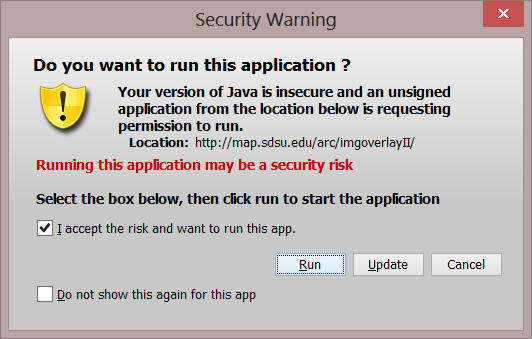
Click on the "Active Java (TM) Platform SE 7U" text. --> Allow NOW.
A "security warning" window may popup. --> check "I accept the risk and want to run this app.
Click on "RUN".
Then you will be able to user these image analysis applets.
-------------------------------
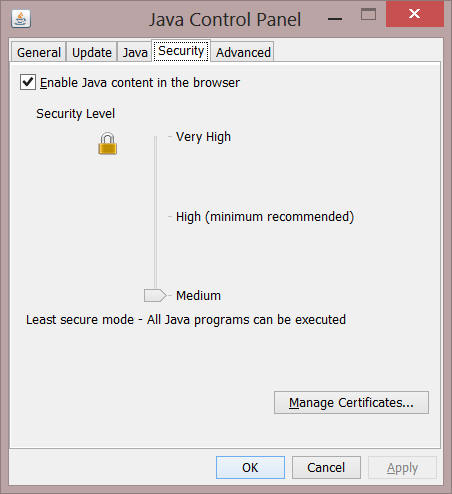
Some Time, you might need to modify the Java Control Panel in your computer to reduce the security setting to "Medium". In order to run these applets.
If you have any questions regarding these issues, please email your TAs for help.
Q1: (2 points) Make a simple comparison between ADAR, IKONOS, and Landsat image products (e.g. company, spatial resolution, spectral resolution, and temporal resolution).
l Image Overlay I and II
The two applets allow users to make comparisons between two images which were captured in 1998 and 1999 respectively. Try the two applets. The Image Overlay II is the enhanced version of Image Overlay I with zooming, and blend/fade control.
For the Image Overlay I, adjust the transparency of the images by moving the slide. For the Image Overlay II (figure 2), use the zoom to scale function to view particular areas of interest.
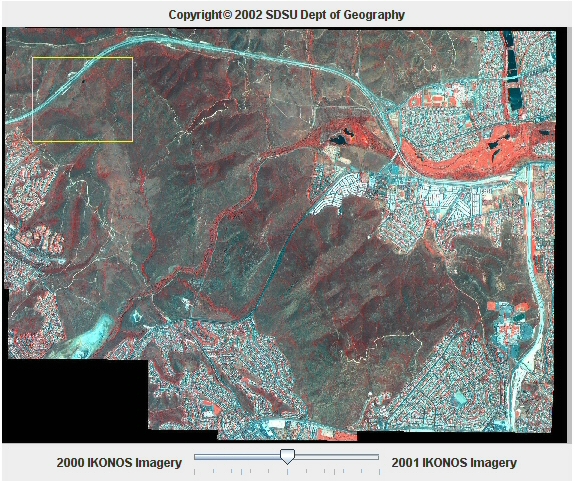
Figure 2: Image Overlay II
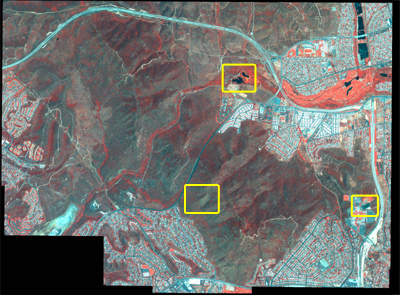
l Image Swipe
This tool offers a more flexible way to make geographic comparisons. Zoom box is also implemented. Two sliders (horizon and vertical) allow users to specify the swipe region.
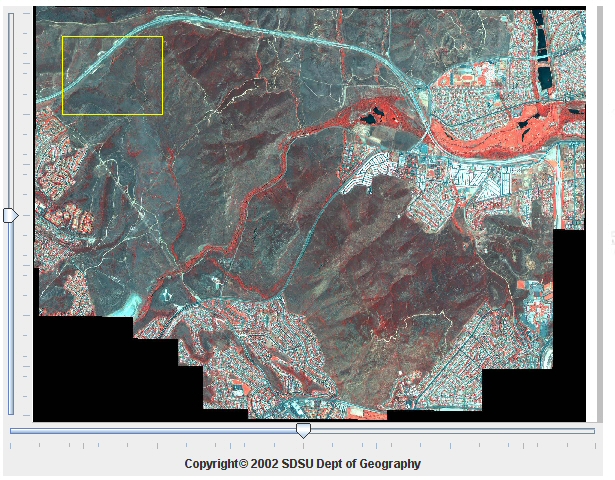
Figure 3: Image Swipe
Q2 (one point): In the three change detection windows (Yellow BOXES), describe the differences of the images (2000 vs 2001) . What types of changes (color changes or the positional changes or both) do the three examples have?
l Image Magnifier
Move the zoom box in the thumbnail map to view the small portion of the image (figure 4).
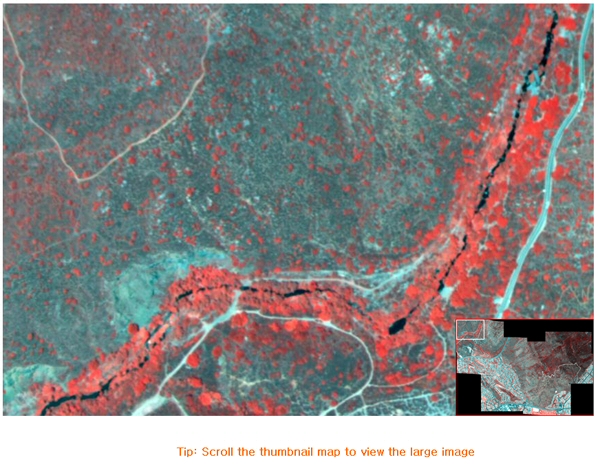
Figure 4: Image Magnifier
l Image Comparison
This tool allows users to compare the multiple images at the same time. For the given multiple images, you can move the mouse on any of the above three thumbnail images to view the desired portion in the large images (figure 5).
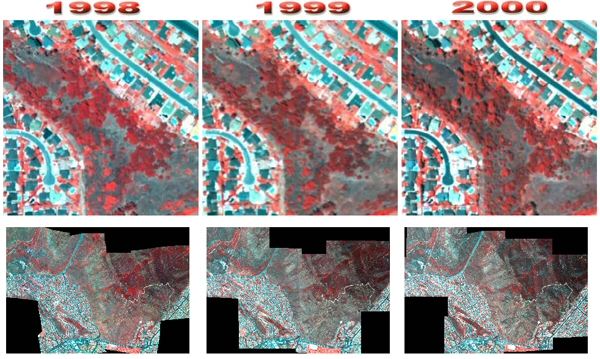
Figure 5: Image Comparison
l Image Processing and Filter
The image processing toolbox consists of:
Grayscale (produce grayscale images; refer to http://en.wikipedia.org/wiki/Grayscale or http://homepages.inf.ed.ac.uk/rbf/HIPR2/gryimage.htm);
Red, Green, and Blue (color filters);
Alpha/Threshold (opaque/ threshold control; refer to http://en.wikipedia.org/wiki/Alpha_compositing and http://en.wikipedia.org/wiki/Thresholding_(image_processing));
Low pass, high pass and high boost (image filters£»low pass filters for smoothing, high pass filters for edge enhancement, and high boost filters as a type of high pass filters with part of low frequency components are kept; refer to http://homepages.inf.ed.ac.uk/rbf/CVonline/LOCAL_COPIES/OWENS/LECT5/node3.html)
ContrastStretch to Min/Max Values (contrast improvement; refer to http://homepages.inf.ed.ac.uk/rbf/HIPR2/stretch.htm);
Increase Brightness,
Decrease Brightness (brightness control);
Negative (produce color reversed images; refer to http://en.wikipedia.org/wiki/Negative_film);
Square root transformation (calculate the square root values of the raw image pixels)
RedBlueSwap, RedGrenSwap and GreenBlueSwap (color swap);
Blur, sharper and emboss;
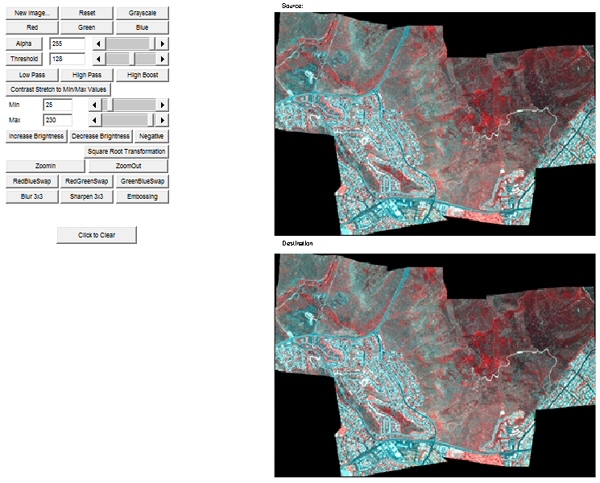
Figure 6: Image Processing
Q3 (one point): Discuss the differences between the filtering results of low pass, high pass and high boost filters. Why the differences?
The Image Filter (figure 7) has similar functionalities.
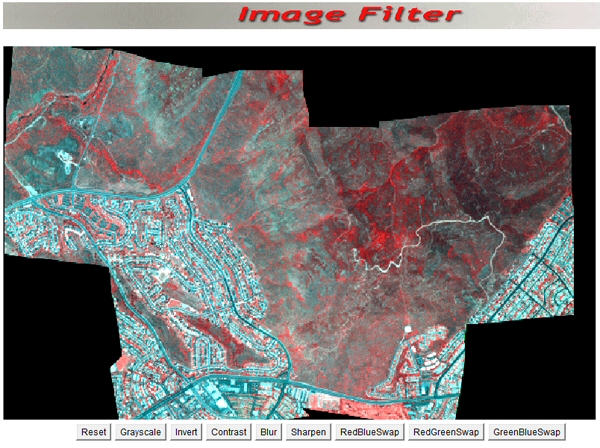
Figure 7: Image Filter
Q4 (one point): In the Image Filter tool, what color is the vegetation and what color is used to represent the roads and buildings? Why? (The image displayed is the 1998 ADAR image for Mission Trails Regional Park).
l Image Viewing
This tool provides the basic zooming and panning functions to take a close look at the interested regions. Two images (2000 and 2001 IKONOS Images) are presented for the purpose of comparison (figure 8).
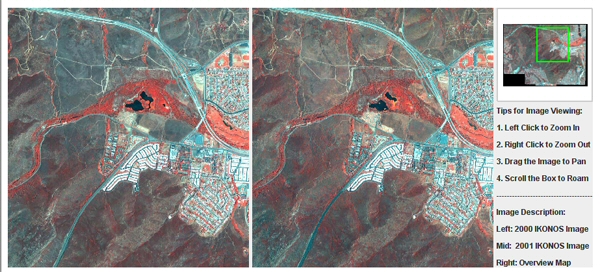
Figure 8: Image Viewing
l Panoramic Image
The last image analytical tool allows users to have a panoramic view at a fixed location. Try both Lake Murray and Mission Trails Visitor Center examples. Move the mouse cursor to the image or the picture to change the view.
Q5 (2 points): Which on-line image analytical tool do you prefer most, which one least prefer? Why? What are the advantages and limitations of these toolkits (functions/user interfaces/data contents/others)?
3. The NASA Earth Observatory ICE (The Image Composite Editor)
The Image Composite Editor (ICE) was developed to let people explore satellite images (http://earthobservatory.nasa.gov/Experiments/ICE/index.php) (Figure 9). In this LAB, we will explore Panama Rainforest example using the ICE. Click the "Rainforests at the Crossroads" on the ICE web page ( http://earthobservatory.nasa.gov/Experiments/ICE/panama/) (Figure 10).
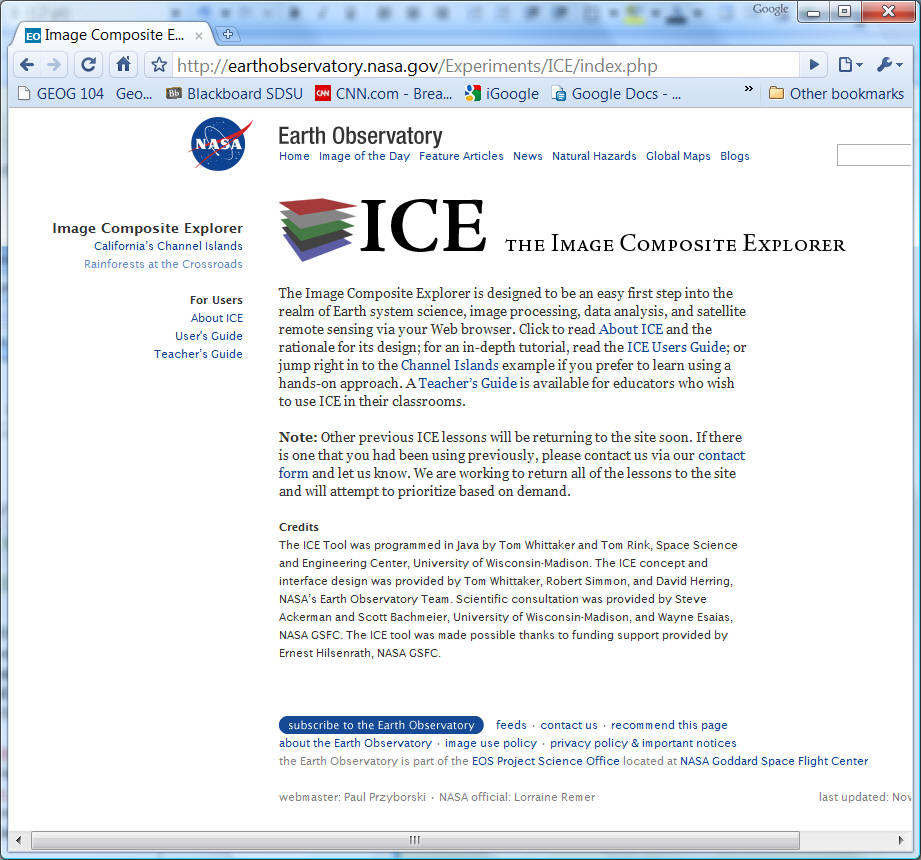
Figure 9: The NASA Earth Observatory ICE.
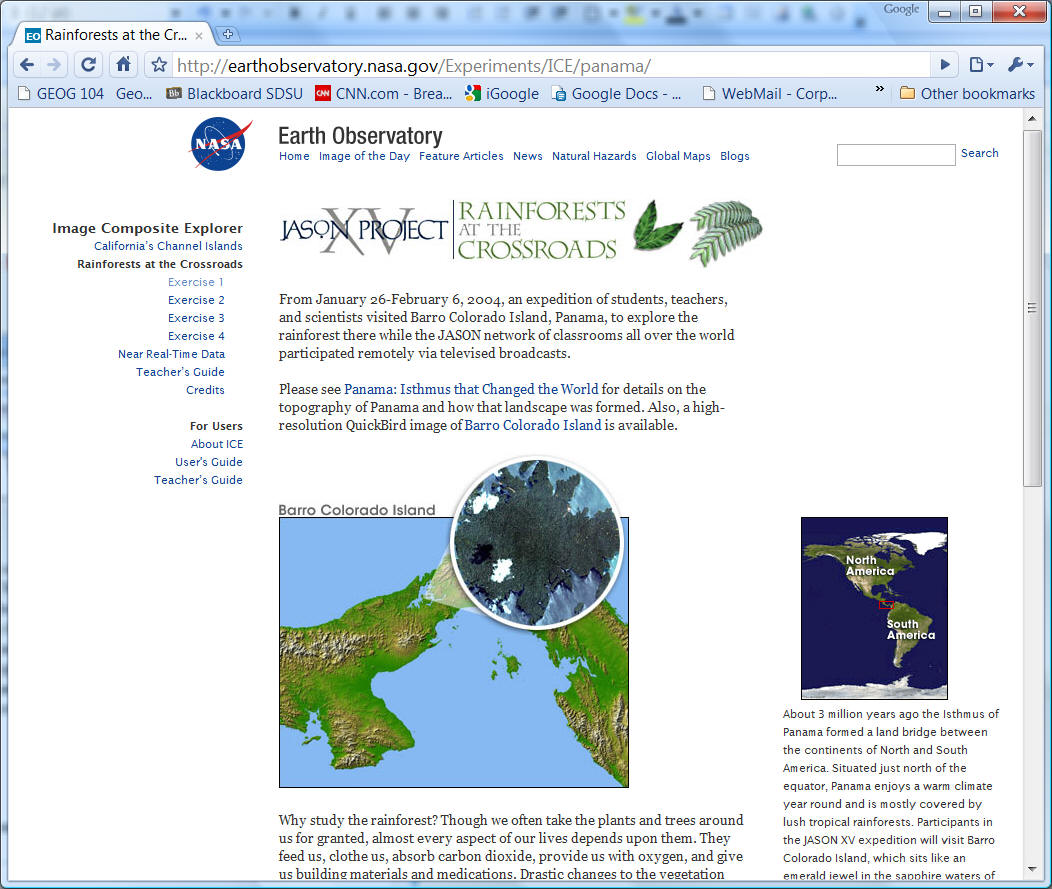
Figure 10: Rainforests at the Crossroads web page
Q6 (one point): Click and read the Exercise 1 web page. What is "false color"? Why do we use it for Remote Sensing?
Next, click on the "Exercise 2", go through this exercise.
On the Exercise 2 web page, select channels for Landsat: March 2000 as mentioned in the web page. Then, the ICE window will pop up.
(Select "Channel 4" for the first channel (RED text), and "Channel 3" for the second channel (Green text), then click on "build")
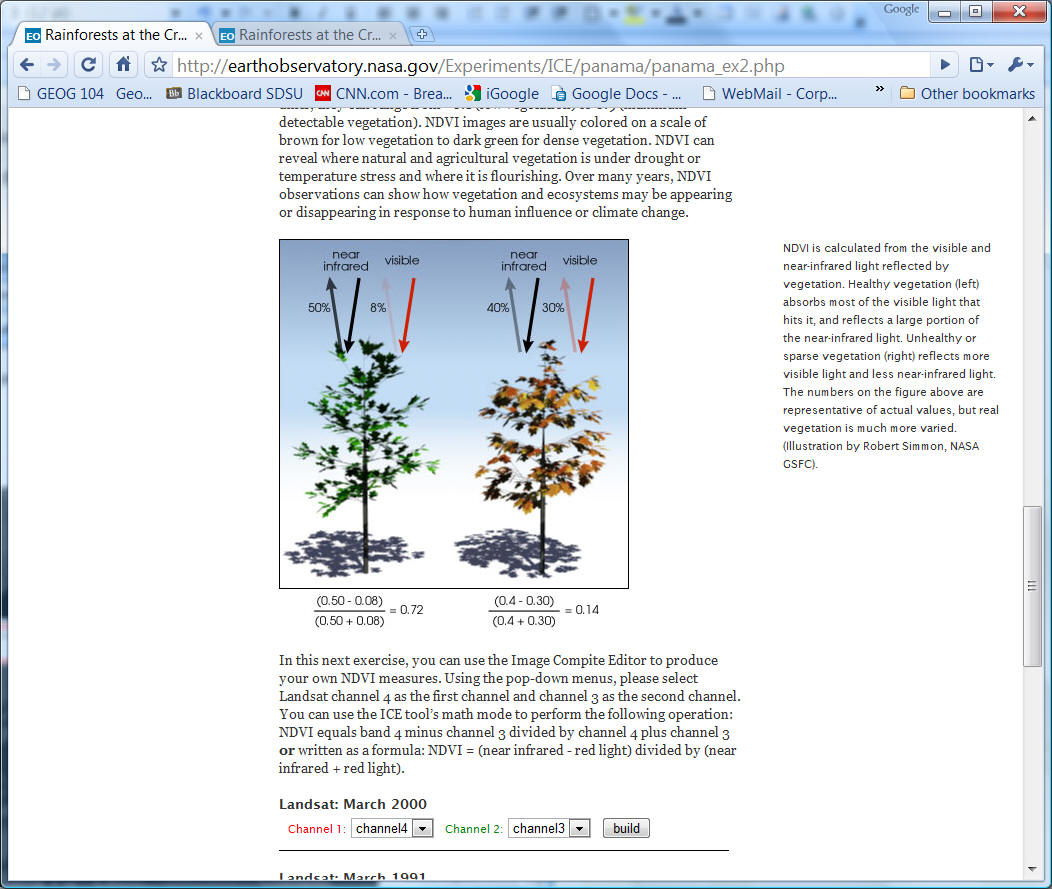
Figure 11: Exercise 2: Green, Greener, Greenest Web page
(If you select the Channel 4 and the Channel 3 and click the "build" button, you will see the ICE like Figure 12)
Q7 (one point): According to the Exercise 2 web page, you should choose channel 4 (near infrared) and channel 3 (red light) for NDVI. What is NDVI? What are the "Wavelength" of two channels? Why does NDVI use channel 4 and channel 3 (refer to Exercise 1 and Exercise 2)?
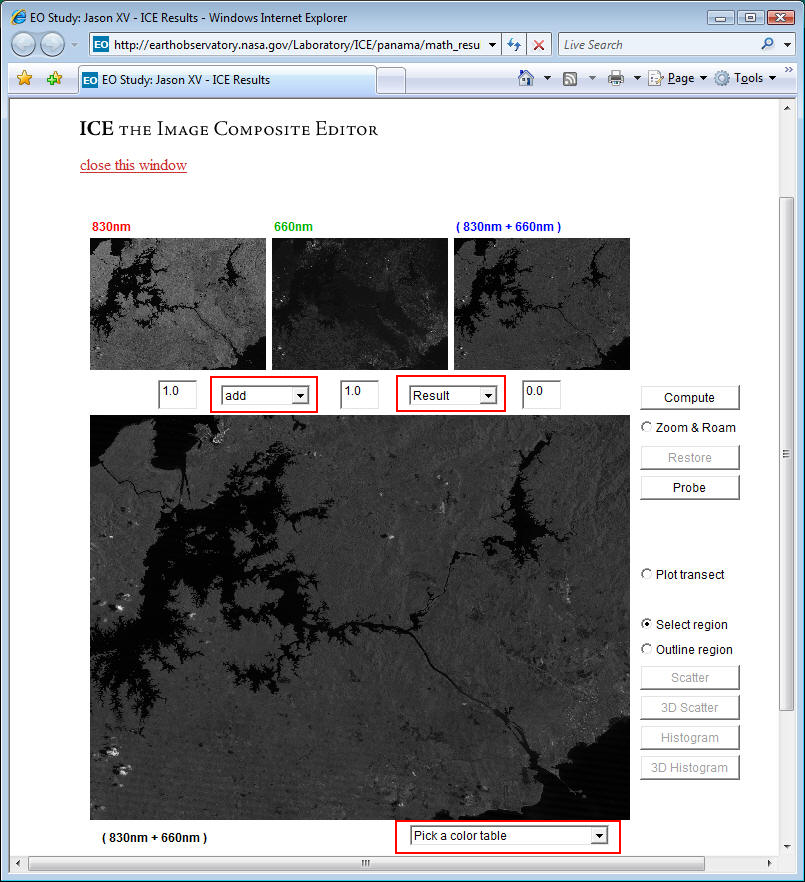
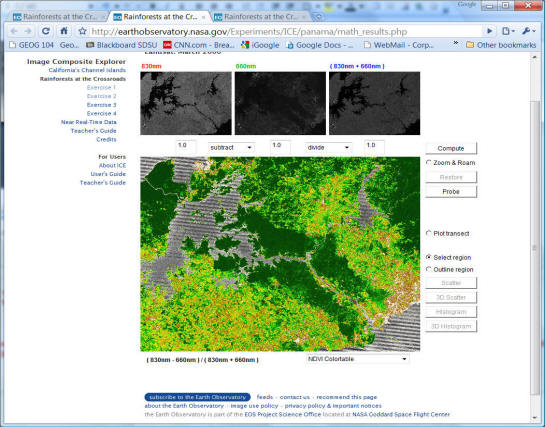
Figure 12: the ICE (This ICE is to calculate the NDVI in the Exericse 2).
Next, you need to create the NDVI map by yourself. You need to select appropriate "operators" to create a NDVI image. Please read [Exercise 2] to help you create the map.
Q8 (one point): In the ICE web page, after selecting appropriate operators such as "subtract", "divide" or etc, you will create a NDVI image. Select "NDVI Colortable" for "Pick a color table". Describe the NDVI geographic pattern. Where vegetation is thick and healthy? Where it is not?
Now you can start to review all your answers and prepare to submit them.
Web-based Exercise #5:
(Remote Sensing and Image Analysis)
Please Answer the Following Questions
Due Day: Dec 03, 2013 -- at the beginning of lecture (11:00 am).