![]()
Geographic Information Science and Spatial Reasoning
(GEOG 104) (A General Education [GE] Course) Spring 2018
![]()
![]()
![]()
|
Geographic Information Science and Spatial Reasoning (GEOG 104) (A General Education [GE] Course) Spring 2018
|
|
| |
|
Geographic Information Science and Spatial Reasoning (GEOG 104) (A General Education [GE] Course) Fall 2015
|
Web-based Exercise #2:
ArcGIS Online (AGO)
Grading: 5 points total (ONE point for each question).
Due Day: Sep. 29 (Tuesday) at the beginning of lecture.
You should upload your lab answers to the Blackboard (http://blackboard.sdsu.edu) before the lecture. We will use the Timestamp on your documents in the Blackboard to check if your assignment is late or not.
If you don't have Internet access, you can use our SAL lab (Storm Hall 338, third floor) on every Friday morning from 11:00am to 12:00pm.
As for this exercise, you will need to capture many screen shots. To capture a screen shot using Windows press 'Print Screen' on the keyboard (if you are using a laptop you may have to press 'Function' and 'Print Screen'). For a Mac press Command-Shift-3 on the keyboard. Using either Mac or Windows to capture a screen shot will put a copy of your screen onto you clipboard, which can then be pasted into a document. When you open a new Word document, press "Ctrl-V" (to Paste) the screen shot into your report.
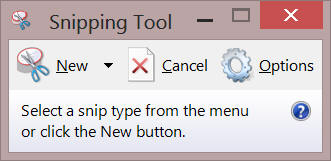
Recent Windows system all have a built in screen shot tool called "snipping tool." --> You can go to the Windows menu and type "snipping" -- and click on Snipping Tool icon to launch it. You can also add the snipping tool on the tool bars. The good thing about snipping tool is that you can manage the scale of the screen shot so the privacy can be protected to some extent.
1. ArcGIS Online
Open a new Window with this link: http://www.arcgis.com/home/
If you don't have an ESRI account, you will need to create one. Click on "Sign-up now" link on the bottom of the window and follow their instruction to create your own account. Please select "Create A Public Account" and follow the instruction. (Make sure to click on "REVIEW AND ACCEPT THE TERMS of USE" and accept the term. Then you can click on "CREATE MY ACCOUNT").
Once you create your public account and sign-in, You can Edit your Profile first. Please add "Taking GEOG104 course at San Diego State University" into your bio text. You can add other information about yourself. [SAVE] your profile after you finish the edit.
Now click on "Map" on the TOP MENU (next to Gallery). Now you will see the My Map window. This map looks like Google Map, but it has many useful GIS analysis functions comparing to Google Map.
The next step is to see different types of "Basemap" in ArcGIS online. Basemaps are important for web mapping because they can provide spatial reference information as "background" and allow users to overlay their theme or key items on the top of basemaps. Different web maps may need to adopt different basemaps.
Click on the "Basemap" icon in the top menu and select one of your favorite basemaps.
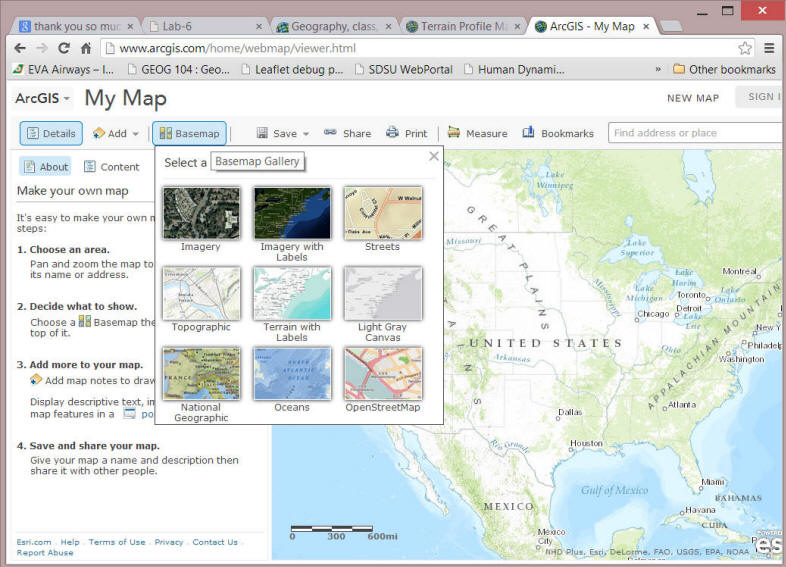
Q1: Which basemap did you selected from ArcGIS online? Why you select this basemap? What kinds of theme layers or data can use this basemap?
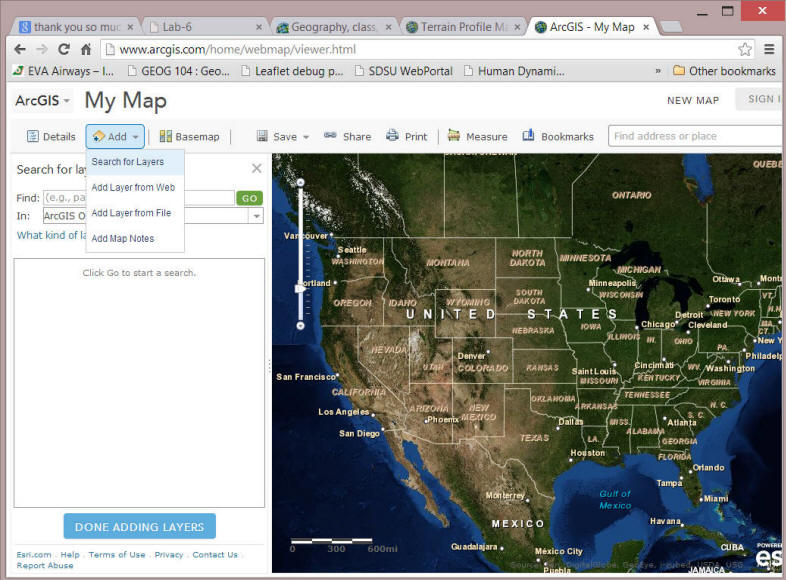
The next step is to add a new layer (as the new theme in your map). Click on "Add", then "Search for Layers".
In the Find: textbox: Type in "San Diego Trolley". Press "GO" bottom. You will see two results found. One of the result is "San Diego Trolley by RupertEssinger". Click on the "Add" link on the right side of the layer name. The San Diego Trolley line should be automatically added into your map.
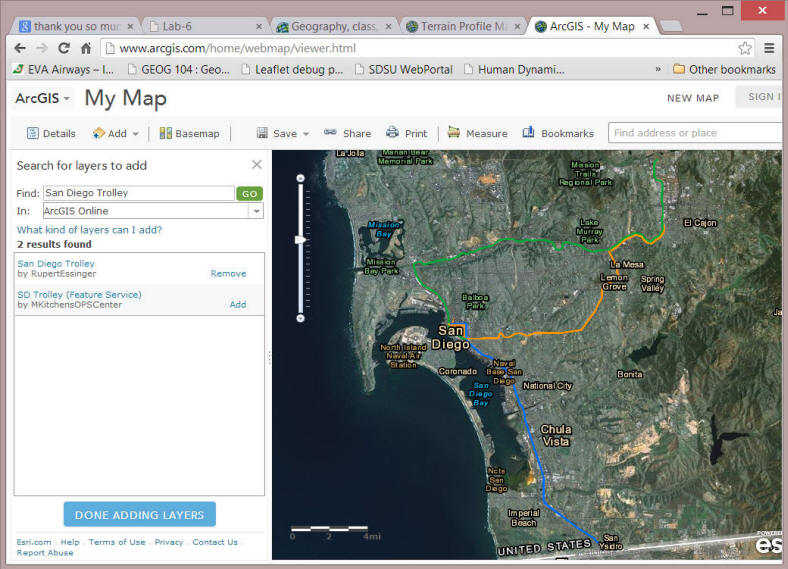
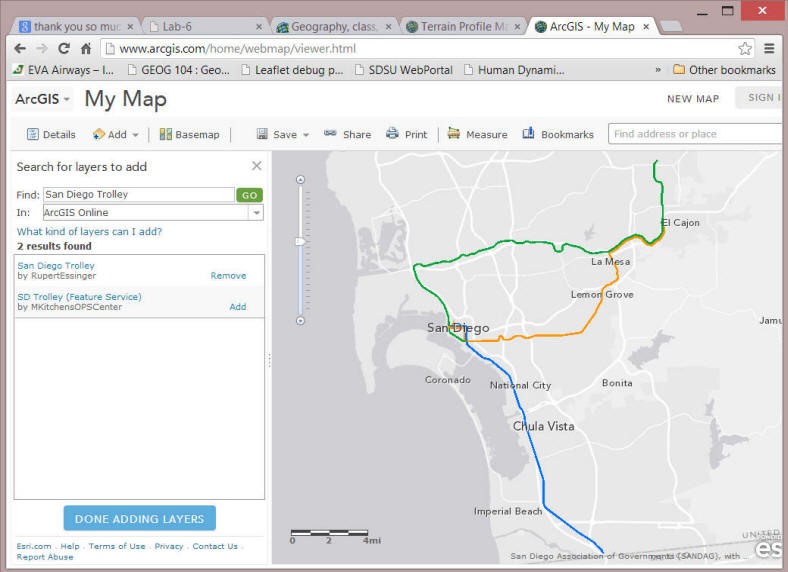
Now you can see that the trolley map might be difficult to be viewed in the basemap you select, you can switch the basemap to "Light Gray Canvas". The trolley lines become more visible now.
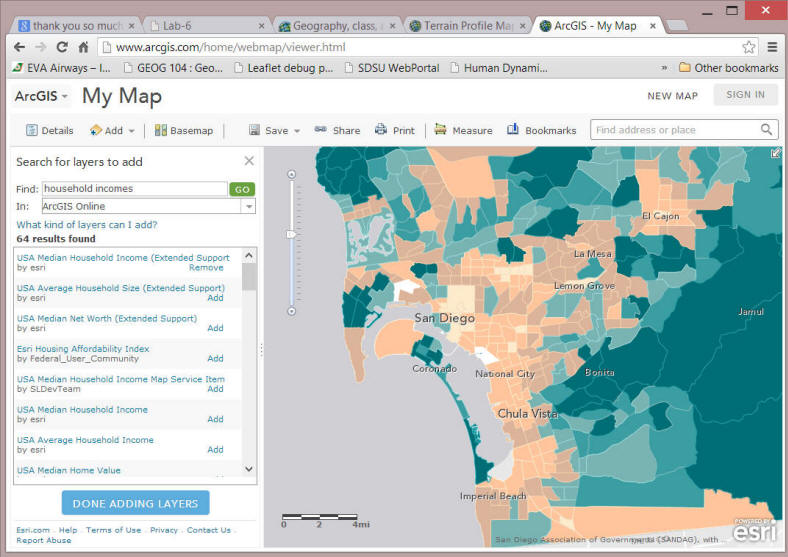
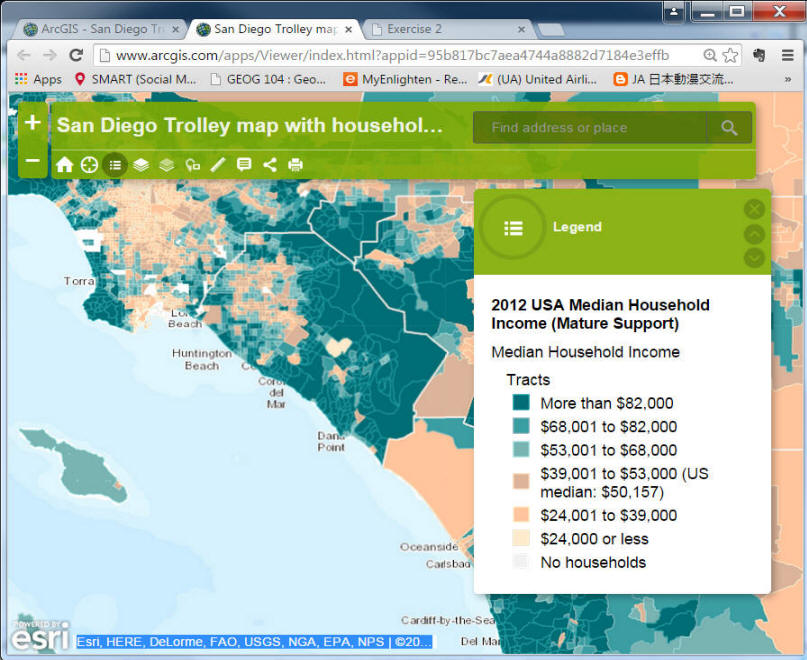
The next step is to add household income level to the map.
In the Find textbox: Type "Household Incomes" and press "GO". You will find the first search result is "2012 USA Median Household Income". Click on "Add" link and add this new layer into your map.
After that, click on "DONE ADDING LAYERS" (Blue color button in the bottom window)
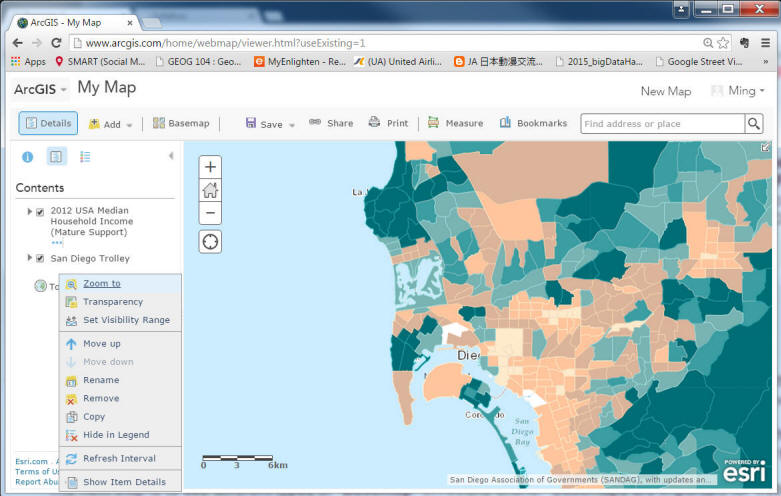
However, you can see that the Trolley lines are blocked by the incomes map now. We need to re-arrange this map to show both the Trolley lines and the Incomes map. To do so, Click on "Content" on the Second-level menu, then move your mouse cursor to the "San Diego Trolley". Click on the tiny THREE DOTS (...) below the "San Diego Trolley" layer to open the tool menu. Then select the "Move up". You will see the Trolley lines showing up on the map again.
Next, click on the "Legend" menu (second level in [Details]).
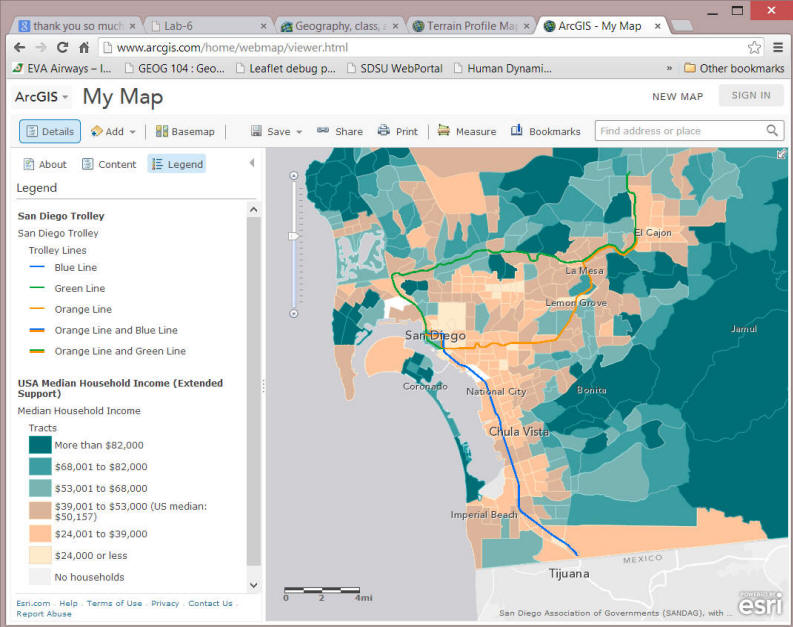
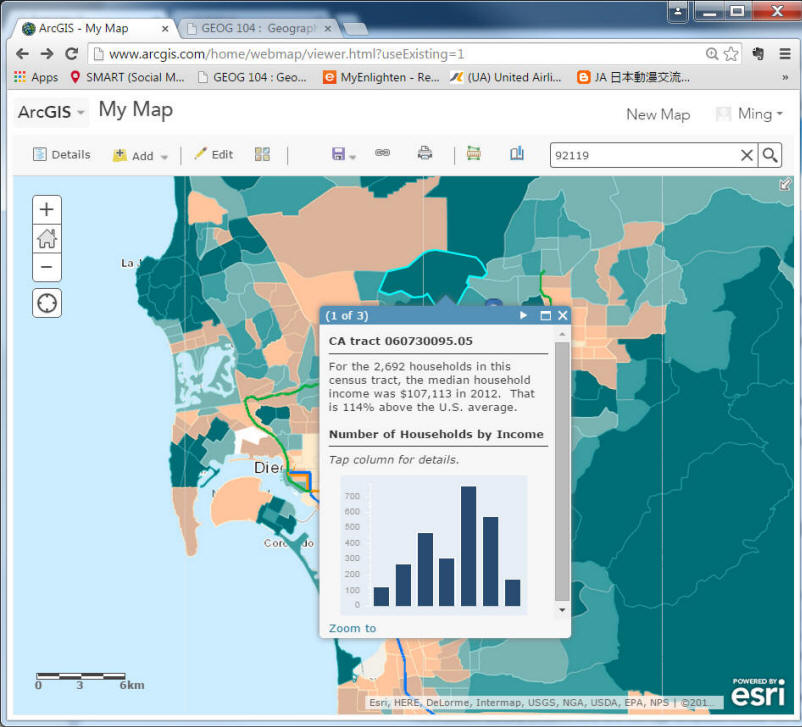
Click on each [Census Track] to see the Median Household Income distribution in your neighborhood.
Q2: When you see the Household Income level map with the San Diego Trolley line. Do you see any spatial relationship between the two layers? Can you explain the spatial relationship you observe.
On the top of this window, next to the Bookmarks icon, you can type in your home address or zip code to Zoom-In to the location. Type your home Zipcode and click on the Search icon. (Example 92119)
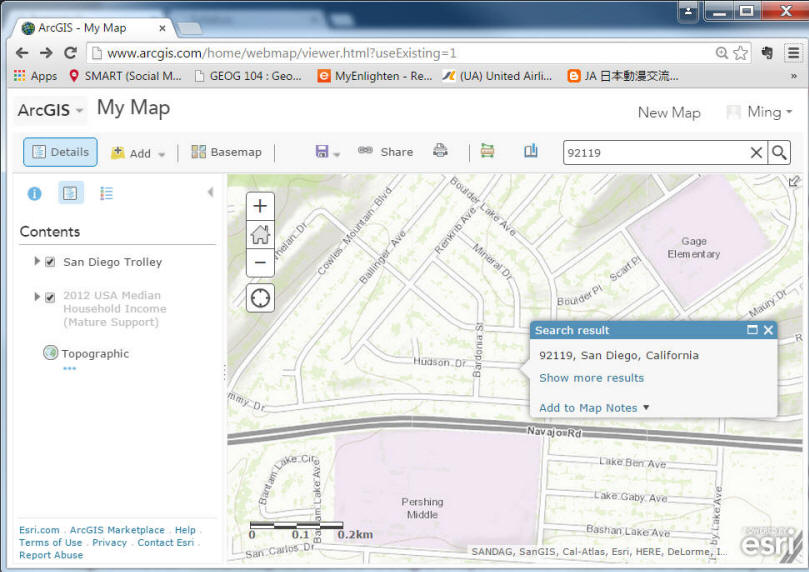
You will see the Search Result. In ArcGIS Online, you can add many Map Notes on different locations to indicate their spatial features and contents, such as my school, shopping mall, etc.
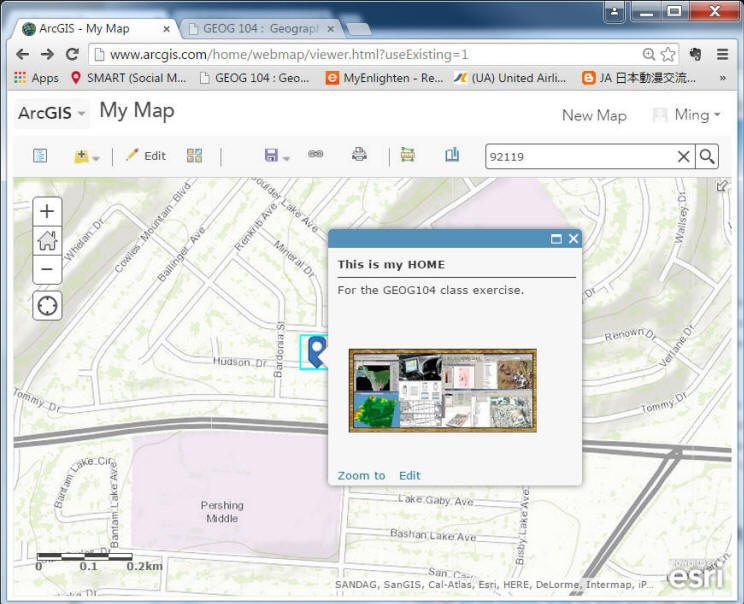
Click on "Add to Map Notes". The location will be added one "Map Note". Click on the Map Note Icon, select "Edit". Now you are entering the "Editing MODE" of ArcGIS Online. You will notice that the "Edit" icon on the Top Menu has been activated.
Now you can change your icon and modify your Map Notes by adding description, new Title, and new images URL and link. For example, you can add the following:
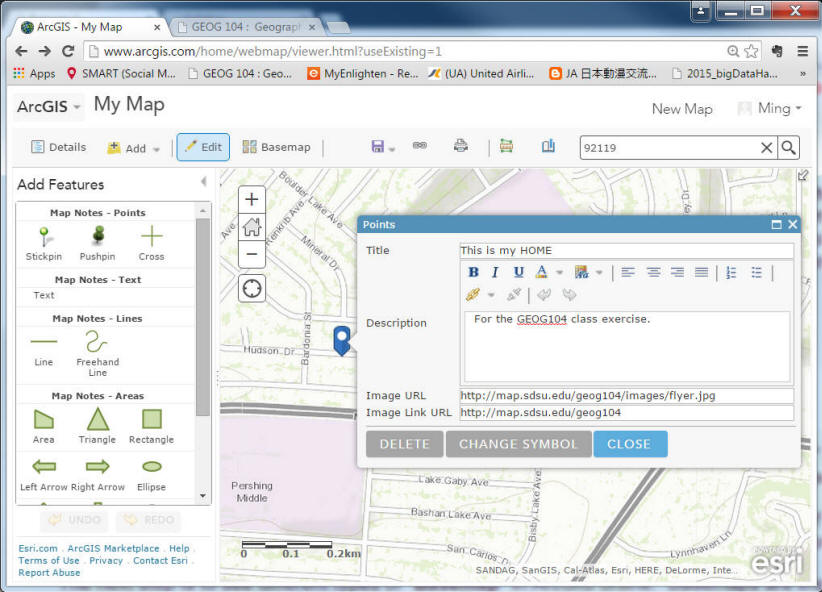
After you added the first map note. Click on CLOSE.
You can use the left side Tool to add more Map Notes, including lines, polygons, etc.
Here is more information about using Map Notes in ArcGIS online.
https://doc.arcgis.com/en/arcgis-online/reference/map-notes.htm
Click on the "Edit" icon on the TOP menu to exit the "Edit Mode".
Now Click on the Map Note icon you just created. See what happen?
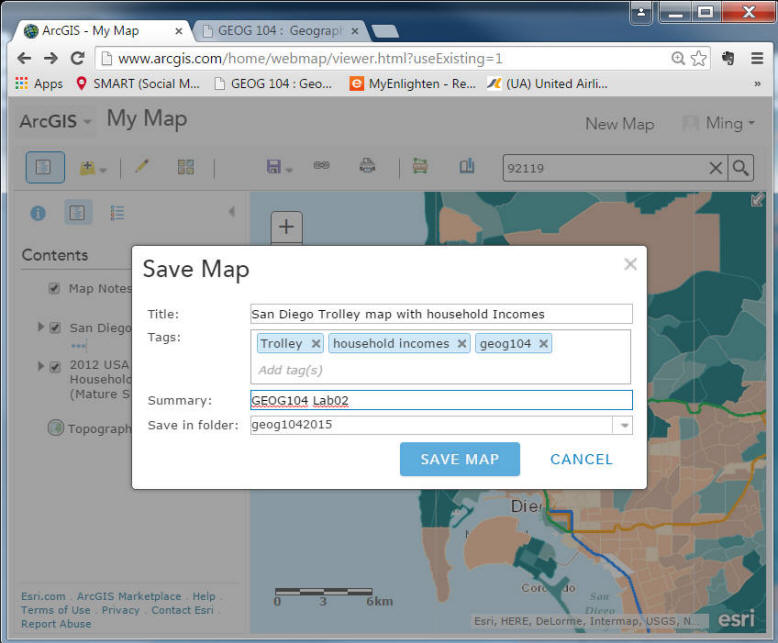
Now before we finish our first ArcGIS online Map, you can save this map. Click on the "Save" button on the Top Menu, then "Save".
In the Save Map Window, type in your map tile, the tags you like to create and the summary description.
Please make sure to type "geog104" into the tags. When adding tags, it is okay when it shows ‘No existing tags match.' Just press 'Enter' key to continue.
Click on "SAVE MAP". This map will be saved into your "Content" folder.
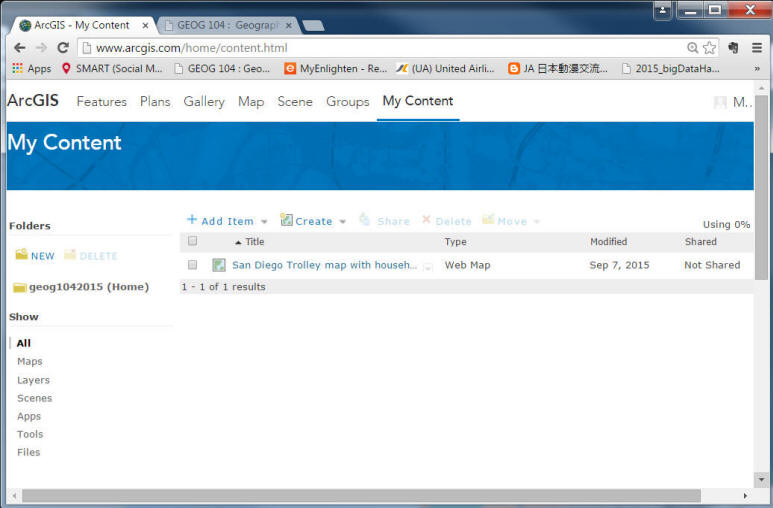
To retrieve your saved map, you can select the "ArcGIS" on the top left window, then select "My Content" from the drop-down list.
2. Review ONE example from the GALLERY in ArcGIS online.
Step ONE: Watch this Introduction Video for ArcGIS online with Public Account: (3 mins)
http://video.arcgis.com/watch/262/use-a-public-account
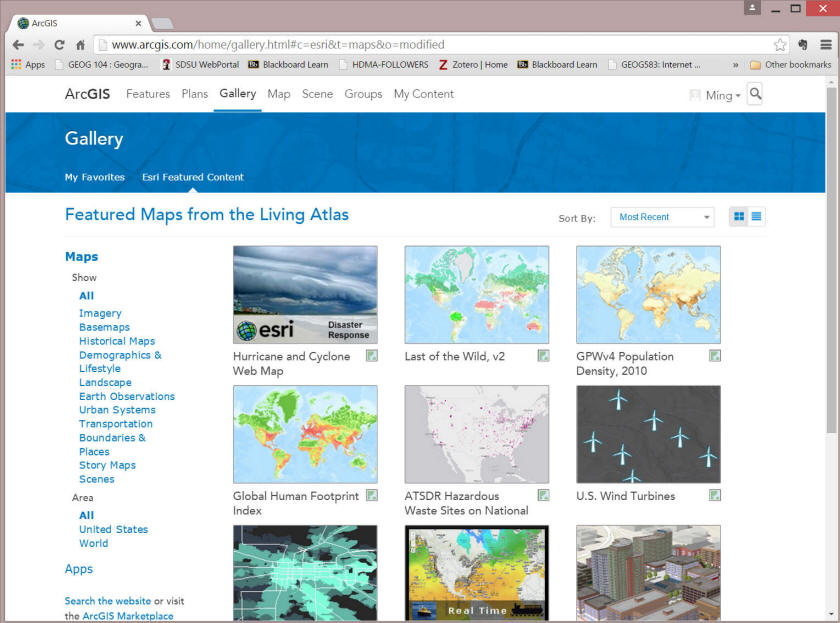
Now click on the "ArcGIS" on the top-left corner, then select "GALLERY" on the ArcGIS online window.
http://www.arcgis.com/home/gallery.html
In the Gallery, the default view is "Maps". When you review these examples, please pick up one "Web Map" and one "Web Mapping Application" example. (see the text under the orange color "Open" button.)
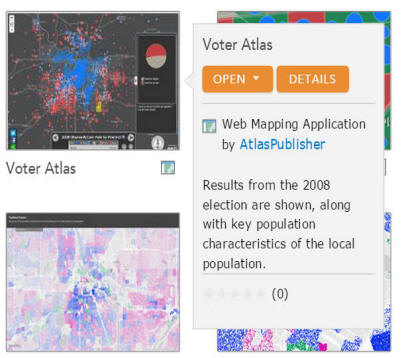
Pick up One Web Map and One Web Map Application from this GALLERY. Take a look with more detail descriptions (Click on "Details" when you select one map). Then open the Web Map or Application you select.
Q3: What are the differences between "Web Map" and "Web Mapping Appication"? Introduce the Map and Application you selected. Provide the URLs to these maps and apps. Discuss what you like and what you don't like in your examples.
3. Create Your Own Map in ArcGIS online
There are some more video and online resources for you to know more about ArcGIS online.
Video Introduction:
http://doc.arcgis.com/en/arcgis-online/reference/videos.htm
Online Help and documents:
http://doc.arcgis.com/en/arcgis-online/
Now it is your turn to create your own map.
Please go to the ArcGIS online again, Sign up with your Public Account: http://www.arcgis.com/home/index.html
Click on the "Make a Map" on the bottom of window if you like to start a new map.
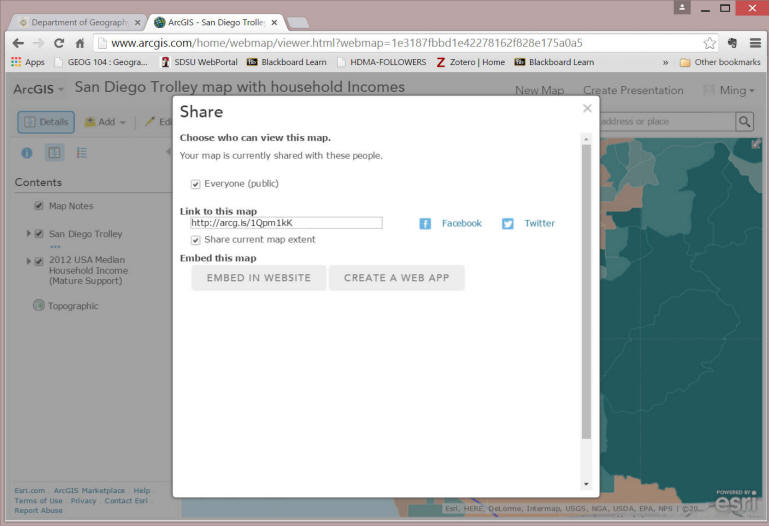
After you finish your own map, Click on "Share" menu. Check out the box "Everyone (public)".,
Copy the URL in the "Link to this map" (the URL is the strings starting with http) Paste it into a NotePad or Word process document for the next Question.
Click on CLOSE after you copy the URL.
Q4: What is the URL of your map? Please describe your map story and each map layer you added in the map. Make a Screenshot of your map (from the Map Viewer) and save it into your report.
NEXT, ArcGIS online provide a very popular tool to convert your map into a fancy Web Application.
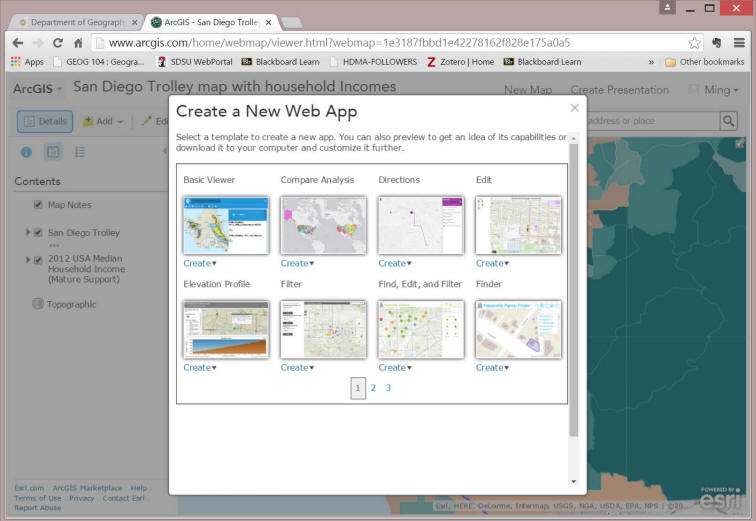
Click on the "Share" menu again, Now, click on "CREATE A WEB APP"
Select one template you like, you can preview it first, if decided, select the "Create"
Enter the title, Tag, and write a summary of your web app. Then click on "SAVE & PUBLISH".
After you close the make application window, your web application has been saved into your "My Content". Open the My Content (from the ArcGIS drop-down menu).
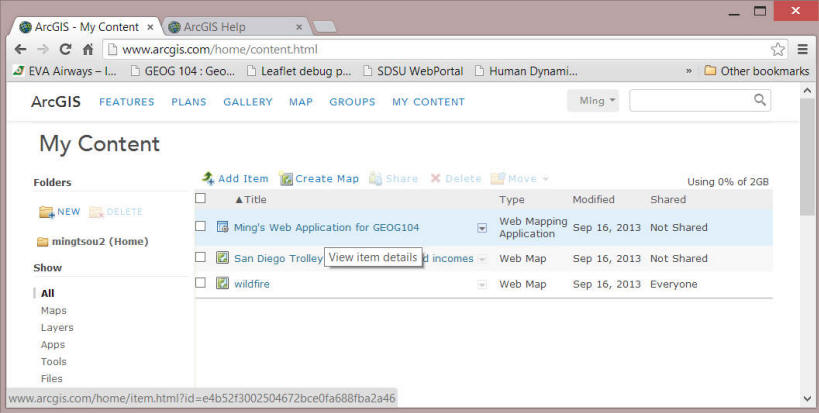
Click on the Web Application you just created., then click on the "OPEN" button. --> View application
Copy the URL from the Web Browser. Save it for the next question.
Q5: What is the URL of your Web Mapping Application? Which Template you select for your Web Mapping Application? Make a Screenshot of your Web Map App and save it into your report. What are the differences between the Web Applications and the Map in ArcGIS online? Comparing to Google Maps, what are the advantages and disadvantages of ArcGIS online?
Please Answer the FIVE Questions in Blackboard
Due Day: Sep. 29 at the beginning of lecture. You should upload your lab answers to the Blackboard (http://blackboard.sdsu.edu) before the lecture. We will use the Timestamp on your documents in the Blackboard to check if your assignment is late or not.
This web site is hosted on MAP.SDSU.EDU
and Geography Department.
|
|