Paradise Fire 7.12Mb
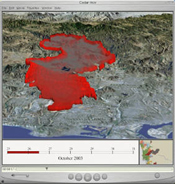
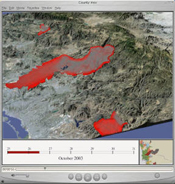
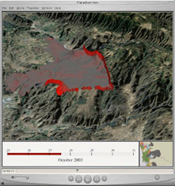
This animation is created by using MODIS data from October 25 to October 31. The fixed red dot in Day 0 indicates the origin of fire. The Red/Yellow dots indicate the hot spots at each day (with different temperature from 305 degrees to 504 degrees (Kelvin). The brown dots indicate previous burned areas. This animation is composed by six separated pictures. (created by Ming Tsou)
Click here to see the separated images
Note: The map is based on the MODIS data which only take a snap shot on Earth surface twice per day. Some burned areas may not be detected by the satellite images.
Home | Research | Static Maps | Interactive Maps | GIS | Mobile GIS | About | Links
Last Updated: May 31, 2005
*Any media or persons are welcome to reproduce or redistribute these maps and information by acknowledging the map producers and the Department of Geography, San Diego State University.
3D Fire Spread Animations
Created by Harry D. Johnson, Department of Geography, SDSU
Requires Quicktime 6.5 or later version
Fire History Animation
Created by David Palomino, Department of Geography, SDSU
Requires
Flash