This
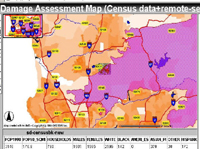
web map overlayed census data (1990 street blocks from ESRI's ArcDATA), ZIP
code areas, and updated fire perimeters (provided by SANDAG) with aerial photos.
You can use query tool to identify the demographic profile of each street blocks.
ArcIMS Map service created by Ming Tsou.
NOTICE:
Since all fire GIS data are gathered from different agencies with different
data uncertainty (data accuracy). The web map may contains some geospatial errors.
Please only use these maps for preliminary reference.
To protect the privacy of home owners, all damaged houses
areas are buffered 100meter and all address information were deleted from
the GIS databases.
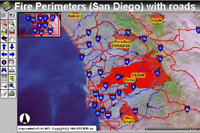
Data
provided by GEOMac, USGS. (ftp://ftp.geomac.gov/outgoing), SANDAG and help from
Rachael Ouellet and Pete Coulter. ArcIMS Map Service created by Ming Tsou.
NOTICE:
Since all fire GIS data are gathered from different agencies with different
data uncertainty (data accuracy). The web map may contains some geospatial errors.
Please only use these maps for preliminary reference.
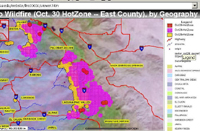
This
web map is created by the help of Rachael Ouellet (digitizing polygons) and
Pete Coulter (georeferencing images). The buffer zone areas are created by 1000
meters buffer distance from the MODIS data on Oct 28, 29, and 30. If you turn
off all hot zones display, you will see a cedar fire image background. (Ming
Tsou)
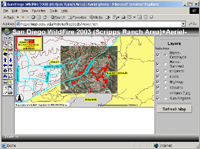
The
data source is from the Scripps Ranch Civic Association (Oct. 28, 10:23am).
The original home addresses have been converted to points on the map and overlayed
with remote sensing images. (Ming Tsou)
NOTICE:
this is not a complete data set. Not all addresses have been entered into the
GIS database. Only 158 records (about 70% of total records) have been geocoded
successfully. The RED dots indicate the destroyed
homes and the BLUE dots indicate the unburned ones.
To protect the Home owners' privacy, ALL addresses information have been removed
from the GIS data after the geocoding process.
*Any media or
persons are welcome to reproduce or redistribute these maps and information
by acknowledging the map producers and the Department of Geography, San
Diego State University.