Two wildfires (Cedar and Paradise) savaged San Diego County during the week of October 26. The wildfires kill 16 people and burned down 2427 homes and businesses (data source: www.signonsandiego.com ). These fires caused the worst damages in the history of San Diego and California. This web site (http://map.sdsu.edu) was created immediately on October 27 (Monday morning) to provide web mapping services for helping our local community. This site is updated daily and provides maps of the San Diego wildfires with various live ArcIMS web mapping services, static maps, and research articles. Most maps on this site have been created by the faculty, staff, and students in the Department of Geography, San Diego State University.
[Enter the NEW Web-based Mapping Services Here]
San Diego 2007 Wildfire mapping ( http://map.sdsu.edu )
Click the following links to access:
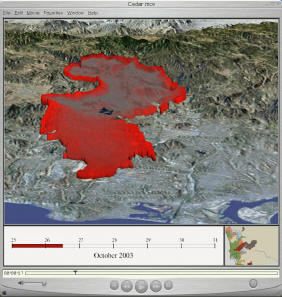
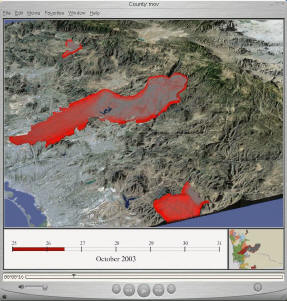
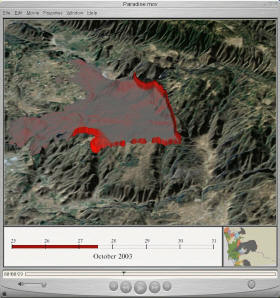
NEW! 3D Fire Spread Animation Movies (created by Harry D. Johnson, Department of Geography, SDSU). Quicktime Movies (Require 6.5 or later version. Click here to download the Quicktime 6.5.1 player. http://www.apple.com/quicktime/download/standalone/ )
(Cedar Fire Animation) (San Diego County) (Paradises Fire)
NEW! SDSU Geography Department is collaborating with San Diego Fire Recovery Network
(SDFRN) now to establish a prototype of the GIS data center for San Diego
Wildfire Recovery and Management. The new GIS data center website
includes downloadble data (shapefiles and coverages and metadata).
Web address:
http://map.sdsu.edu/fireneti
New Update! Mobile GIS/GPS Mapping (Enter Here)
Click here to see the large-size Panoramic View
(Mission Trail Regional Park)
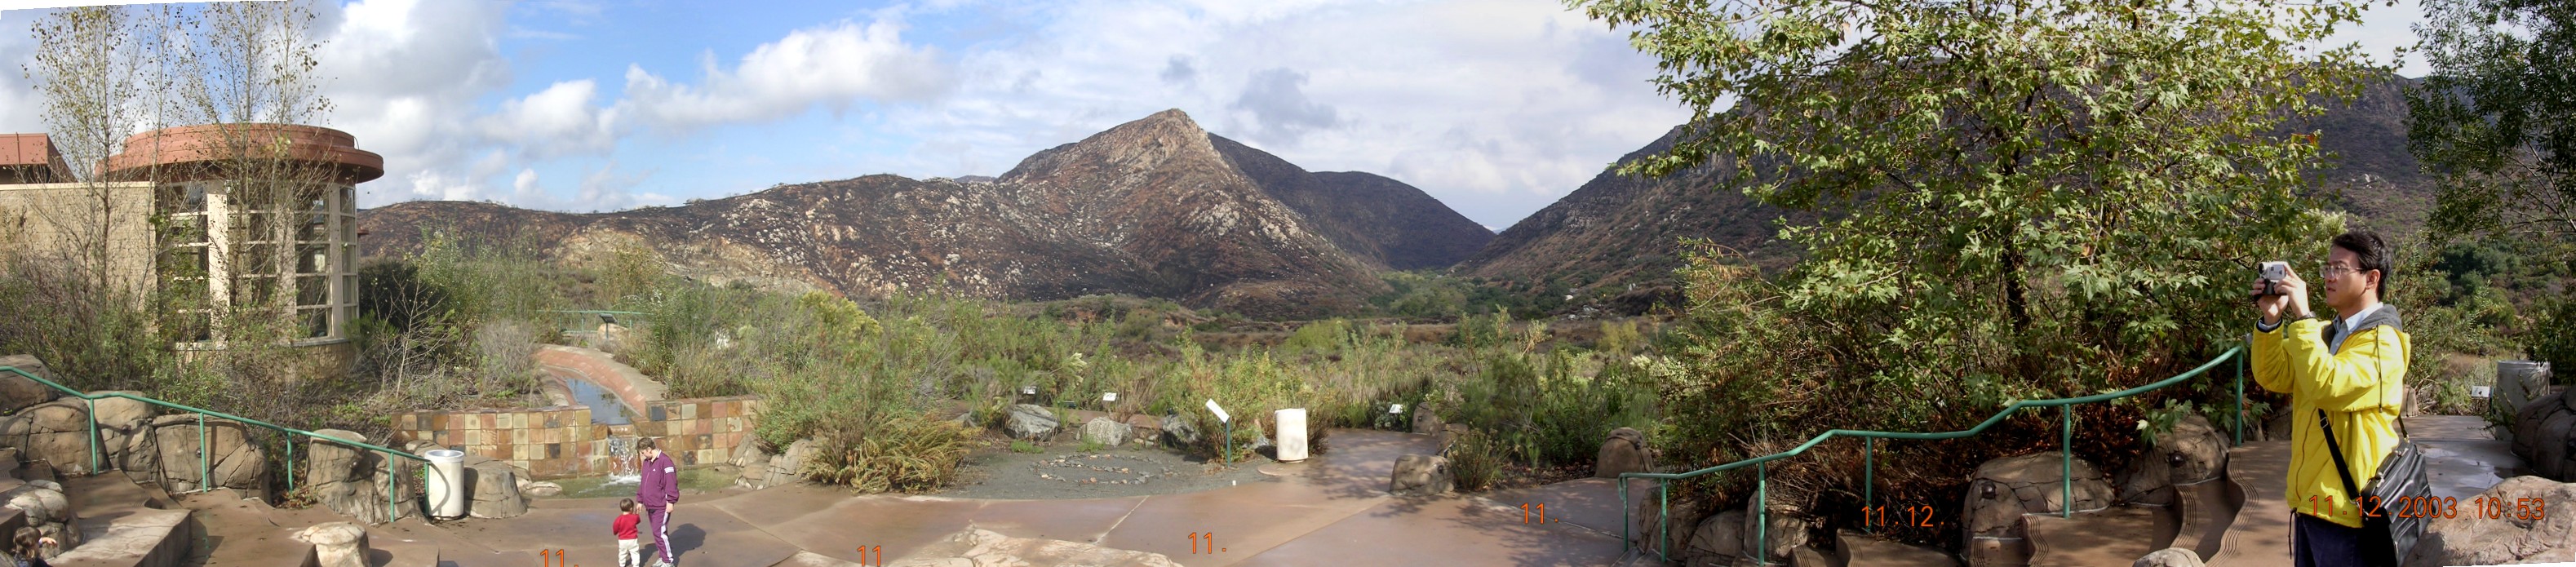
New! Download Field Trip Movie (November 12, 2003):
Animals survived after the fires. The following picture was taken on November 12, 2003 (two weeks after the wildfires). The picture shows two mid-size animals standing on the top of the mountain (the red circle) near Highway 15).
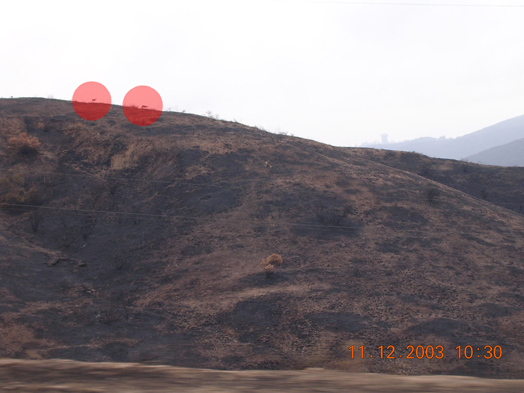
 This is the original picture.
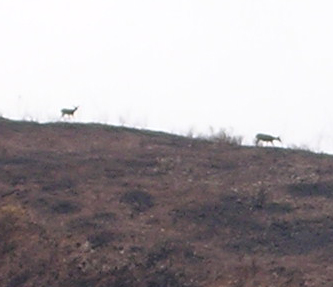 This is the
zoom-in picture.
This is the
zoom-in picture.
[ Interactive Web Mapping Services ]
[Click Here to enter the Web Mapping page]
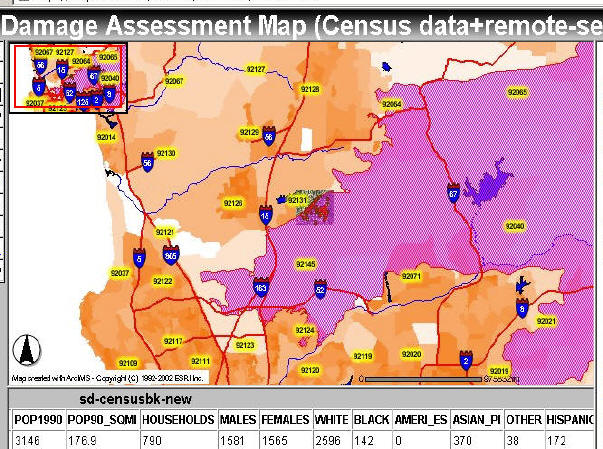
Damage Assessment Map
With Census Data and Fire Perimeters (from SANDAG) http://map.sdsu.edu/website/fire2003eNEW/, this web map overlayed census data (1990 street blocks from ESRI's ArcDATA), ZIP code areas, and updated fire perimeters (provided by SANDAG) with aerial photos (2001 DOQQ). You can use query tool to identify the demographic profile of each street blocks. (created by Ming Tsou)
NOTICE: Since all fire GIS data are gathered from different agencies with different data uncertainty (data accuracy). The web map may contains some geospatial errors. Please only use these maps for preliminary reference.
Click Here
to open the map viewer (30 seconds).

Special Thank to SANDAG staff for providing updated fire perimeters.
(If this ArcIMS doesn't work, try the backup service here http://map.sdsu.edu/website/fire2003e/ )
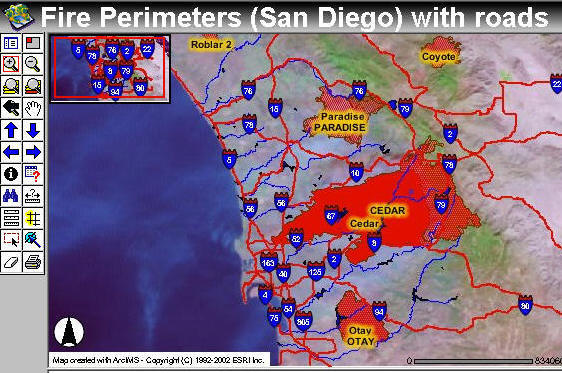
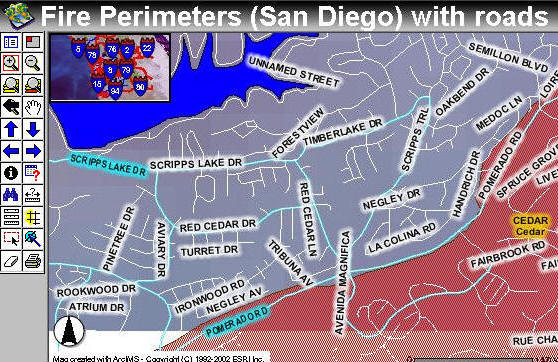
Fire Perimeters with detail roads (street labels) ( http://map.sdsu.edu/website/fire2003d/ ) Date provided by GEOMac, USGS. (ftp://ftp.geomac.gov/outgoing) and SANDAG. with help from Rachael Ouellet and Pete Coulter. (ArcIMS Map Service created by Ming Tsou)
NOTICE: Since all fire GIS data are gathered from different agencies with different data uncertainty (data accuracy). The web map may contains some geospatial errors. Please only use these maps for preliminary reference.
Web Mapping Services: (click here see the detail descriptions of these services)
Ecological Impact and Environmental Monitoring at Mission Trail Regional Park http://map.sdsu.edu/website/fire2003mtrp/
October 30 - Hot Zone Areas ( http://map.sdsu.edu/website/fire2003c )
Aerial Photos with Geocoded burned homes in the Scripps Ranch Areas ( http://map.sdsu.edu/website/fire2003b )
Geocoded burned homes in the Scripps Ranch Areas (without aerial photos) ( http://map.sdsu.edu/website/fire2003a )
[ Multimedia Maps -- Animation, 3D ]
Fire Spread Animation (Oct 25-Oct 31)
Note: The map is based on the MODIS data which only take a snap shot on Earth surface twice per day. Some burned areas may not be detected by the satellite images.
This animation is created by using MODIS data from October 25 to October 31. The fixed red dot in Day 0 indicates the origin of fire. The Red/Yellow dots indicate the hot spots at each day (with different temperature from 305 degrees to 504 degrees (Kelvin). The brown dots indicate previous burned areas. This animation is composed by six separated pictures. (created by Ming Tsou) (Click here to see the separated images and other animation maps)
[ Static, Printable Map Gallery ]
[Click Here to enter the map gallery page]
NEW! Potential Landslide area analysis! (map created by David Palomino <david_geo@yahoo.com> , JR Morgan, and Tim Seeno)
Fire History Map
(created by David Mckinsey dave@typhoon.sdsu.edu )
Click the map to view high-resolution maps.

Official Government Links:
City of San Diego Emergency Fire Information. http://www.sannet.gov/newsflash/firealert.shtml
San Bernardino Joint Information Center, USDA Forest Service http://jicfire.calmast.org/index.html
BAER (Southern California Burned Area Emergency Response) http://www.fs.fed.us/baer/
Maps and Images Links:
THE HPREN Time lapse animations and other images of the Cedar Fire incident http://hpwren.ucsd.edu/Cedar/
The USFS Pacific Southwest Research Station http://www.fireimaging.com/
ESRI Map Links of the California Wildfires http://www.esri.com/news/pressroom/firemaps.html
USDA Forest Service, Remote Sensing Application Center (link information provided by Ramesh Rao, Jennifer Kay, and David Palomino): http://activefiremaps.fs.fed.us/large_fire/large.php#
USGS Wildfire Science Applications and Support
(link information provided by Rachael Ouellet)
http://wildfire.usgs.gov/
California Wildfire Viewer
http://wildfire.usgs.gov/ca_geomac/viewer.htm (If this link doesn't work,
try http://wildfire.usgs.gov/, then
select the Wildfire Viewer).
http://earthobservatory.nasa.gov/Newsroom/NewImages/Images/California.A2003299_lrg.jpg ( Southern California at full MODIS resolution at 1000m resolution, also have 500 and 250 m resolutions) (link information provided by Dr. Eric Frost and the Center of Information Technology and Infrastructure, SDSU)
http://earthobservatory.nasa.gov/NaturalHazards/natural_hazards_v2.php3?img_id=11808 Is the general fires page with last 7 images listed, along with fires around rest of world. (link information provided by Dr. Eric Frost and the Center of Information Technology and Infrastructure, SDSU)
http://modis.gsfc.nasa.gov/gallery/individual.php?db_date=2003-10-29 Mongolia fire and processing like could shortly be done of So. Calif. (link information provided by Dr. Eric Frost and the Center of Information Technology and Infrastructure, SDSU)
http://modis.gsfc.nasa.gov/gallery/showall.php View of images of the day for quickly picking out relevant ones with extra processing and descriptions. (link information provided by Dr. Eric Frost and the Center of Information Technology and Infrastructure, SDSU)
http://seawifs.gsfc.nasa.gov/SEAWIFS.html SeaWiFS page is featuring fire images http://seawifs.gsfc.nasa.gov/cgi/seawifs_subreg.pl (link information provided by Dr. Eric Frost and the Center of Information Technology and Infrastructure, SDSU)
http://asterweb.jpl.nasa.gov/gallery/images/fire-631.jpg (link information provided by Dr. Eric Frost)
http://asterweb.jpl.nasa.gov/gallery/gallery.htm?name=sanberdofire (link information provided by Dr. Eric Frost)
NASA website: http://www.nasa.gov/home/index.html )
http://rapidfire.sci.gsfc.nasa.gov/gallery/?2003299-1026/California.A2003299.1840.721.250m.jpg (Information provided by Dr. Douglas Stow).
Vertical Profile of the Smoke off California (link information provided by John Kaiser) http://earthobservatory.nasa.gov/Newsroom/NewImages/images.php3?img_id=16347
Wildfires Rage in Southern California (link information provided by John Kaiser) http://earthobservatory.nasa.gov/Newsroom/NewImages/images.php3?img_id=16346
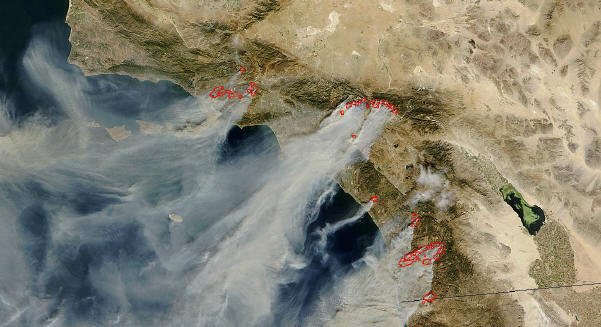
Date 10-27-2003, Satellite Image of San Diego wildfires (Data source:
http://www.nasa.gov/home/index.html
)
Online GIS data related to the wildfire at San Diego:
SANDAG updated (New) fire perimeters available from the SANDAG ftp site ( SANDAG posted the data temporarily in 2003). This was the most accurate FIRE Perimeters polygons generated by SANDAG GIS professionals. The archived SANDAG fire perimeters can be found in GIS Data Center for Fire Recovery Network: http://map.sdsu.edu/firenet/ or SanGIS (www.sangis.org).
MODIS Active Fire Detections for the United States (2003) (displaying Hotspots) http://firemapper.sc.egov.usda.gov/modispts.htm and http://firemapper.sc.egov.usda.gov/modispts/modisfire_2003.htm (metadata descriptions)
Fire Perimeters from USGS GeoMAC FTP site: (anonymous login) ftp.geomac.gov --> select outgoing --> 2003_fire_data/California -->perimeter****.shp (All U.S. wildfire perimeter, updated daily).
San Diego Base Maps SANDAG (San Diego Association of Governments) http://www.sandag.org/ --> on the right side, select [Maps and GIS] --> [GIS data for download] http://www.sandag.org/index.asp?subclassid=100&fuseaction=home.subclasshome
The USFS Pacific Southwest Research Station collected thermal imagery on multiple days during the fires in San Diego. The sensor is called FireMapper, and has 3 thermal bands, a red, and a near-infrared band. The imagery is very high resolution 0.3 to 2.0 m resolution. Georeferenced image products are available for free online (they are in GeoTIFF format). The images provide a very detailed look at the location and intensity of the fires, at the time(s) of acquisition. The web site is: www.fireimaging.com. (Link information provided by Lloyd (Pete) Coulter.)
Download GIS data from SDSU website (13 MB Zip file)
All GIS shapefiles from this site used the same SPCS California VI coordinate system. The following is the descriptions of data in the compressed zip file:
Origin (the origin of fire, manually digitized based on the San Diego Union Tribune Newspaper, thank to Rachael Ouellet)
Scripp-de-new (burned houses locations in Scripps Ranch using address matching tools from ArcMap. To protect the privacy of home owners, all addresses have been removed from the attribute table.)
Scripp-s-new (unburned houses locations in Scripps Ranch using address matching tools from ArcMap. To protect the privacy of home owners, all addresses have been removed from the attribute table.)
Sdfire-oct31all (Clip out MODIS fire hotspot data using the boundary of San Diego County, point data with temperatures and date).
SDperimeters (Fire perimeter updated on Nov. 3rd from USGS GeoMAC ftp site. The data was clipped out by the boundary of San Diego County and converted to SPCS coordinate systems).
Georeferenced image files: cedar_oct28 (San Diego fire), fire_631_georef (San Bernardino fire) with World files.
Special Thanks to USGS/Geography Discipline and GeoMac to provide updated GIS data for our web mapping services.
(SDSU data generated by Ming Tsou)
Mitigation, Response, and Recovery (short-term recovery and long-term recovery).
Spatial Decision Support Systems. By utilizing a standardized web mapping interface, individual participating agencies can implement their own data systems and services while maintaining an aggregated system-wide interoperability through multiple data warehouses and web-based decision support systems (Figure 1). Two data warehouses (one operational and one for emergency backup) should be established to provide the gateway for accessing geo-spatial data and remote sensed imagery for various applications. Each data warehouse will update their data automatically by communicating with each local database server through standardized communication protocol (Z39.50, TCP/IP, and HTTP) and OpenGIS catalog interface. The web-based Spatial Decision Support Systems (SDSS) will provide on-line mapping functions and the display of remotely sensed data. The web-based SDSS can used by decision makers and spatial analysts in command and control centers to collect and process information via a secure intranet or encrypted mobile wireless networks, to make decisions and initiate responses to field locations and on-site officers.
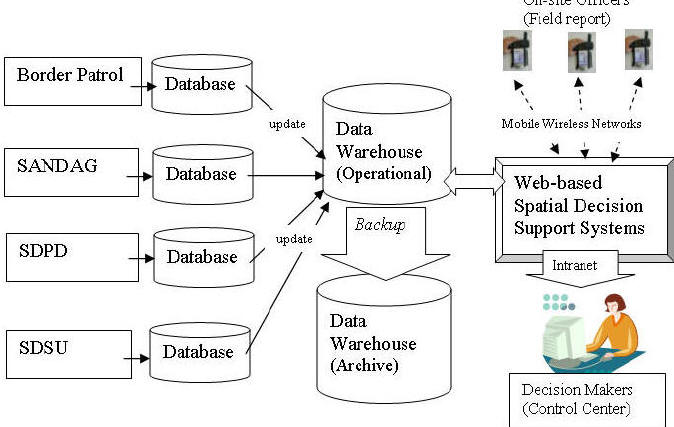
Figure 1. Interoperable database framework for web-based spatial decision support systems.
Mobile GIS. Establish a working example for the integration of mobile GIS applications. The mobile devices will have the integrated capabilities of GPS, GIS, and remote sensing. Web-based mapping facilities can be integrated with wireless mobile devices and GPS. Currently ESRI’s ArcPAD is the pocket-size GIS software which can be used in this research. Also, Microsoft provides several free development tools for mobile and embedded applications under their .NET framework, such as the Microsoft Mobile Internet Toolkit (MMIT). MMIT adopted Wireless Markup Languages and compact HTML (cHTML) which can be applied for mobile devices.
The following figure illustrates a possible working
example of one such mobile GIS solution. In this example, an Internet map server
is installed on a notebook computer with wireless access port. The notebook and
wireless access port will be placed inside a vehicle to provide power for
wireless communication. Field workers can use Pocket PC’s with GPS and a
wireless card to access large remote-sensing imagery and GIS data from the
server via Wi-Fi communication channel. The whole system is mobile and suitable
for various environmental monitoring tasks.
Figure 2. Wireless Local Network Solution for Mobile GIS
Along with the progress of computer networks and the popular use of the Internet, distributed geographic information services and Internet mapping facilities have emerged as primary research areas in geographic information science (GIScience). The need for global access to and decentralized management of geographic information is pushing the geography community to deploy a distributed geographic information service (GIService) architecture on the Internet. However, current research mainly focuses on data interoperability and ad-hoc technique-centered solutions without considering the uniqueness of on-line spatial information and the distribution of geographic information systems (GIS) processes.
The goals of this research Web site are to facilitate the development of on-line GIS applications from a short-term, technology-centered project to a sustainable development strategy.
A prototype of dynamic Internet map server (DIMS), a GIS-oriented software agent model, and a geoagent communication protocol (GCP) will be developed and installed in this Web site in order to identify the requirements of distributed GIServices and the implementation procedures of Internet mapping facilities. This Web site is also used for the development of a new course curriculum, GEO 596 (Internet Mapping and Distributed GIS), and its lab exercises.
This Web server includes the following information:
This Web server also hosts the following Web sites:
Related Courses:
NASA REASoN project: http://geoinfo.sdsu.edu/reason
NSF-ATE Scalable GIS education (technology) project: http://geoinfo.sdsu.edu/hightech
San Diego Emergency Response GIS Data Portal: http://geoinfo.sdsu.edu/metadataexplorer
Other Internet GIS resources:
Special Thanks
Special thanks to the following people and
organizations for their great help and supports:
The California Institute for Telecommunications and Information Technology -- Cal(IT)2 URL: http://www.calit2.net Director: Dr. Larry Smarr.
The Center of Information and Technology Infrastructure (CITI) at SDSU, Co-Director: Dr. Eric Frost and Bob Welty
Haley & Aldrich (Underground Engineering & Environmental Solution) http://www.haleyaldrich.com/home.html Robert Manriquez.
ESRI http://www.esri.com Tim Craig and Rupert Essinger