3D Visualization and Animation Maps
GIS force group Mapping Services
Animation of the Fire Oct 21-24 (By Andrew Gordon, Aude Esperbe, and Grant Fraley)
3D Animation of the Fire Oct 21-24 (By Aude Esperbe)
Click HERE to download a 3D movie (WMV format, 12MB) (created by Aude Esperbe)
3D Animation of the Fire 2003 (Orange color) and the Fire 2007 (Red color) (By Aude Esperbe)
In this animation, the first part is the 2003 CEDAR fire (orange color), and then the 2007 fires (Red color). The brown points in between represent the area that used to be burned by the 2003 fire. We can compare the spatial pattern between the two major wildfire and see their differences.
Animation of the Fire Oct 21,22,23 (By Ick Hoi Kim)
NASA JPL Wind Direction Map (With animation): http://ourocean.jpl.nasa.gov/SCB/ (special thanks to P Peggy Li <Peggy.Li@jpl.nasa.gov>)
KMZ file for JPL Wind Direction Map Animation
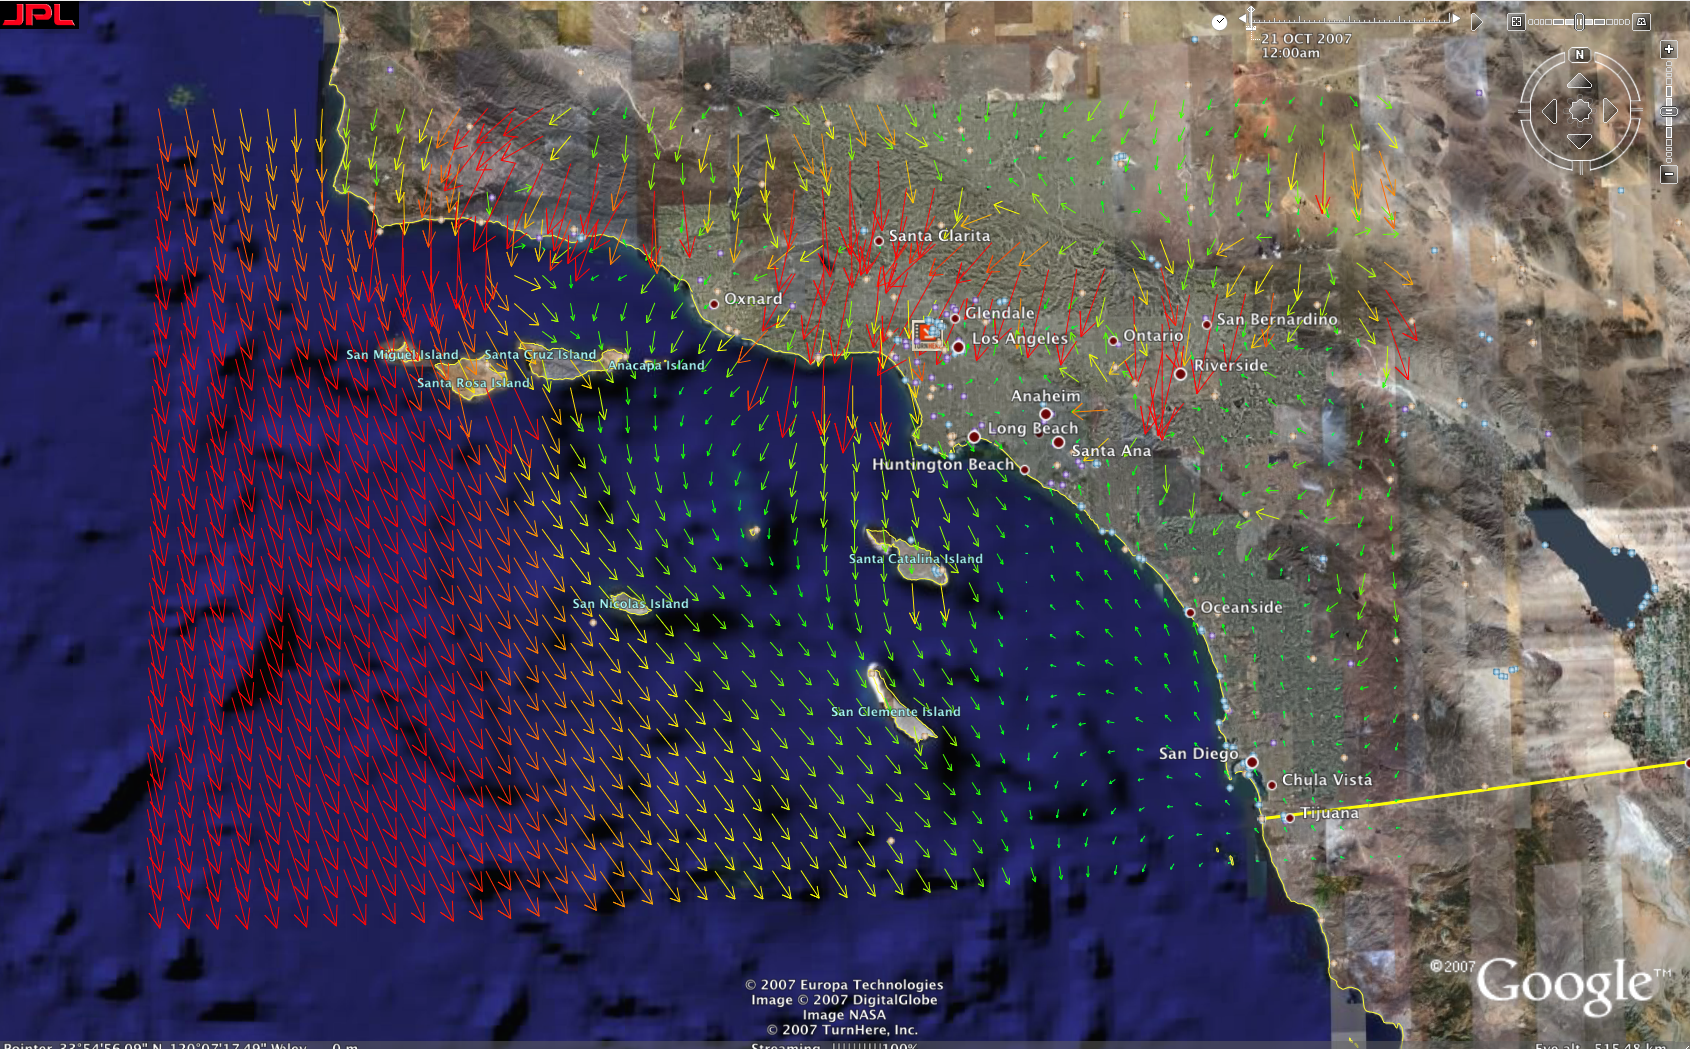
NASA JPL Wind Direction Map Animation (Thanks to Aude Esperbe)