![]()

Geographic Information Science and Spatial Reasoning
(GEOG 104) (A General Education [GE] Course) Spring 2018
![]()
![]()
![]()
|
Geographic Information Science and Spatial Reasoning (GEOG 104) (A General Education [GE] Course) Spring 2018
|
|
| |
|
Geographic Information Science and Spatial Reasoning (GEOG 104) (A General Education [GE] Course) Fall 2015
|
Unit 10
Geospatial Visualization
![]()
Eagle or Letter?

Visualization
For a long time, visualization was treated as a powerful tool and approach to represent and explore the scientific and nature phenomena. The same situation also happens in geographical research and GIS. As Buttenfield and Mackaness (1991, p.427) indicate, "Visualization is an important component of any effort to understand, analyze or explain the distribution of phenomena on the surface of the earth, and will become increasingly important as volumes of digital spatial data become more unmanageable." The GIS communities also attempt to develop improved products to "support for complex analytical application, including tracking of data lineage, tools for visual interaction with the stages in the analysis process, propagation of uncertainty" (Rhind, Goodchild and Maguire, 1991, p.320). The content of visualization is very broad, including human cognition, analysis of scientific or physical data, computer graphic display and so on. The following definition of visualization by Buttenfield and Mackaness (1991, p.432) is more sophisticated and complete:
Definition: Visualization is the process of representing information synoptically for the purpose of recognizing, communicating and interpreting pattern and structure.
(synoptically: a general view of a whole )
Its domain encompasses the computational, cognitive and mechanical aspects of generating, organizing, manipulating and comprehending such representations. Representations may be rendered symbolically, graphically, or iconically and are most often differentiated from other forms of expression (textual, verbal, or formulaic) by virtue of their synoptic format and with qualities traditionally described by the term 'Gestalt'. (Buttenfield and Mackaness, 1991, p.432)
However, there are some differences between visualization of information and the visualization of information processing and analysis.
Visualization of Information
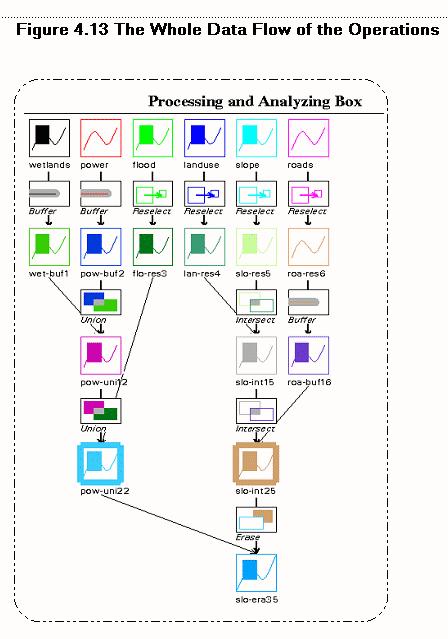
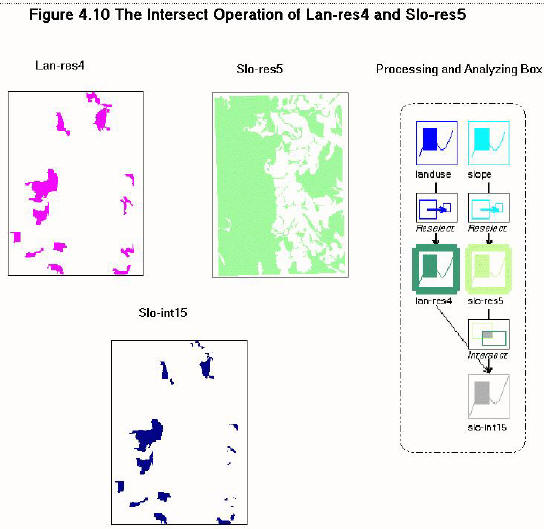
visualization of information processing (Visual programming)
Human Visual System:
http://webvision.med.utah.edu/ (Webvision Home Page).
(Figures from http://webvision.med.utah.edu/imageswv/sagitta2.jpeg )
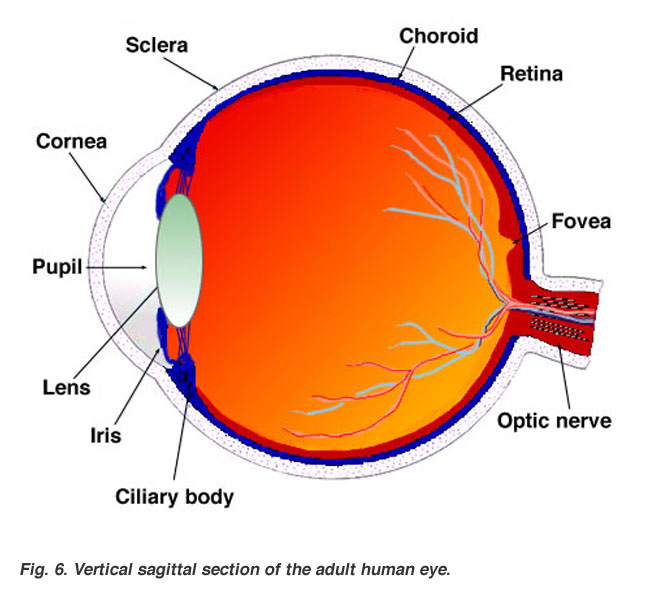
Rods and cones are specialized nerve cells that contain light-sensitive chemicals called visual pigments, which generate an electrical responses to light. (Slocum, et. al, p.182)
Theories of Color Perception:
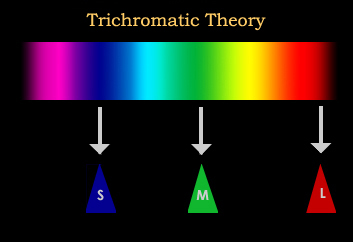
Image resource: http://www.psych.ucalgary.ca/PACE/VA-Lab/
colourperceptionweb/theories.htm
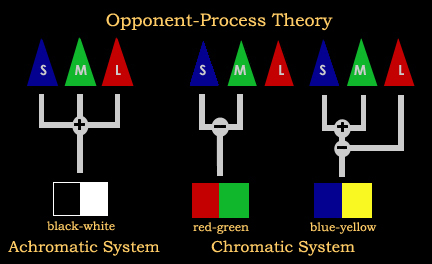
Image resource: http://www.psych.ucalgary.ca/PACE/VA-Lab/
colourperceptionweb/theories.htm
Color vision impairment (4 percent in U.S.): anomalous trichromats (three colors combined) dichromats (two colors combined).
Primary Visual Cortex: http://webvision.med.utah.edu/VisualCortex.html
COLOR MODEL
Visual Variables: Color variables:
Hue, Saturation, Value
RGB Model: additive color combination
RED, GREEN, Blue
http://www.susqu.edu/webcentral/rgbcolor.cfm
(Web site: background color # 00FF00 -->? Green color)
(problem: equal step in the RGB color space do not correspond to equal visual steps.)
(CC) (99) (66) (33)
B B B B
CMYK Model: subtractive colors. (K: Black)
(For printing)
(Image from http://www.sketchpad.net/basics4.htm )
HSV Model
http://en.wikipedia.org/wiki/HSV_color_space
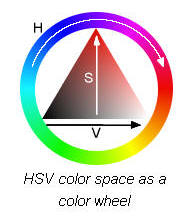
(Same problem with RGB: selecting a color midway between two colors will not result in a color that is perceived to be midway between those colors.)
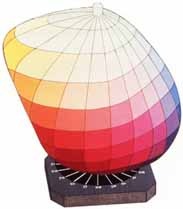
Munsell Model:
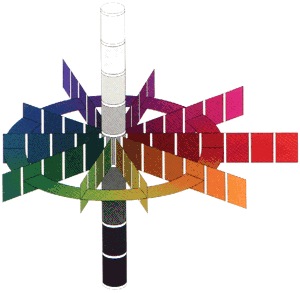
Musnsell model is asymmetrical, because the model is perceptually based.
(the lightest possible green does appear brighter than the lightest possible red).
GREEN RED
HVC Model: hue, value and chroma: developed by Tektronix on computer graphic display.
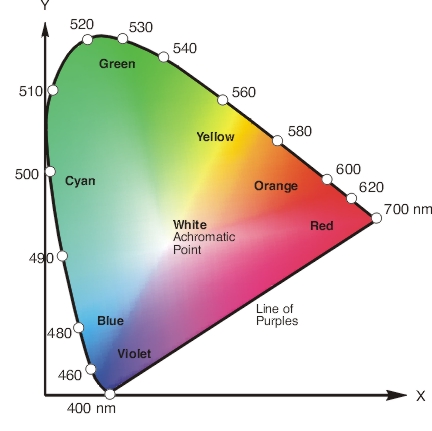
CIE Model: Commission International De l'Eclairage.
Image from : http://www2.ncsu.edu/scivis/lessons/colormodels/color_models2.html
Map Display Hardware
CRTs (cathode ray tubes)
Three electron gun: Red, Green, and Blue.
Additive color.
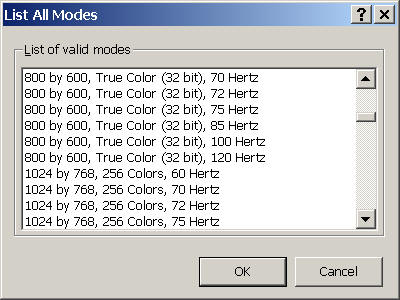
Three phosphors compose a pixel. (Resolution of a monitor)
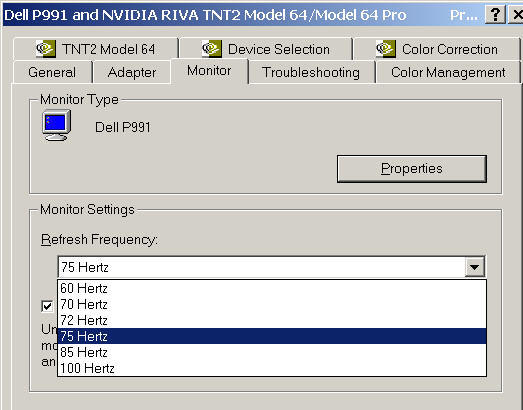
The CRT screen must be refreshed constantly. (Refresh Frequency).
Color on a CRT screen
Frame buffer is an area of memory that stores a digital representation of colors:
R + G + B
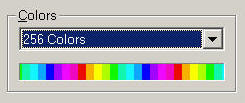
8 bits (2x2x2x2x2x2x2x2) = 256 (each color gun)
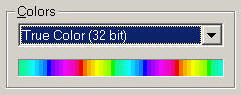
256 (R) x 256 (G) x 256 (B) = 16.8 million colors (TRUE color)
LCDs (Liquid crystal display), http://en.wikipedia.org/wiki/Liquid_crystal_display
Plasma Display (Pictures from online digitalhome magazine)
OLED: organic light-emitting diode, a display device that sandwiches carbon-based films between two charged electrodes, one a metallic cathode and one a transparent anode, usually being glass.
http://en.wikipedia.org/wiki/Organic_light-emitting_diode
http://www.youtube.com/watch?v=NcAm3KihFho
Bistable display: (Mobile Display Devices) retain on-screen images even after the power has been turned off.
http://www.pcmag.com/article2/0,1759,1566190,00.asp
http://www.youtube.com/watch?v=jvy755teCG4
DLP, LCOS...
PCMagazine: What's new with Displays
http://www.pcmag.com/article2/0,1759,1566186,00.asp
Geographic/Cartographic Visualization
(GVIS / CVIS) (DiBiase 1990, MacEachren 1994)
From MacEachren's book How Maps work p. 12)
The map is .... not as a communication vehicle, but as one of many potential representations of phenomena in space that a user may draw upon as a source of information or an aid to decision making and behavior in space.
(Source: Alan MacEachren, "Visualization in Modern Cartography: Setting the Agenda," in A.M MacEachren and D. R. F. Taylor (eds.). Visualization in Modern Cartography. Oxford, England: Elsevier, 1994. p. 6.)
"Representation"
Lexical sense: the level of meaning in its broadest sense.
Semiotic sense: functional level, symbolic function.
Social level?
Cognitive level?
MacEachren (page 355, How maps work, 1995).
Visualization is a term with many meanings. In the most general sense of "to make visible".... visualization can also refer to making visible in the sense of mental image. ... Geographic Visualization (GVIS), like "map", is probably best viewed as a fuzzy (probably radial) category. ...
What are the differences between Buttenfield's definition and MacEachren's definition?
Art vs. Science
Two views:
HOW to design a "nice" map?
HOW to design a "useful" map?
Let's review some examples of the ESRI Map Books (2000-2004).
http://www.esri.com/mapmuseum/
Animation (one of the visualization methods)
(San Diego Wildfire Animation, Animated GIFs)
Early development back to 1930s with camera and hand-drawing maps. --> computer-based animation: Waldo Tobler's 3D portrayal of a population growth model for the city of Detroit. (1970). (stored in Video Tape now).
1991, David DiBiase and Alan MacEachren -- define visual variables for animation and categorize various types of animation. (MacEachren, A.M. and D. DiBiase. 1991. Animated Maps of Aggregate Data: Conceptual and Practical Problems. Cartography and Geographic Information Systems 18:4, pp. 221-229.)
"Animation requires additional visual variables beyond those used for static maps, namely duration, rate of change, and order."
Duration: (d) is the length of time that each frame of an animation is displayed. Short duration --> smooth animation, long duration --> choppy animation. (slow motion vs. fast forward..) (frame 1 --> one second --> frame 2)
Rate of Change: (m/d) is the magnitude of change (m) divided by the duration of each frame (A --> A1) or (A --> C). (point --> location changes, or change the size of points)
Order is the sequence in which frames are presented. (We can re-order the frames to change effects of animation). (Back-ward play)
Example: NASA California Wildfire animation.
http://svs.gsfc.nasa.gov/vis/a000000/a002800/a002858/index.html
Types of Animations:
Emphasize change: change in position vs. change in an attribute.
Time series emphasize change through time. Examples: AIDS Mortality in the United States http://www.ciesin.org/datasets/cdc-nci/regions.html
Re-expression provides an alternative graphic representation (like change the classification methods in Population density).
Dr. Michael Peterson's animation (Change of classes and change of classification methods)
http://maps.unomaha.edu/books/IACart/book.html#ANI
Emphasize location (warning signals)

Emphasize attribute
Dr. Michael Peterson's animation (Change of attributes)
http://maps.unomaha.edu/books/IACart/book.html#ANI
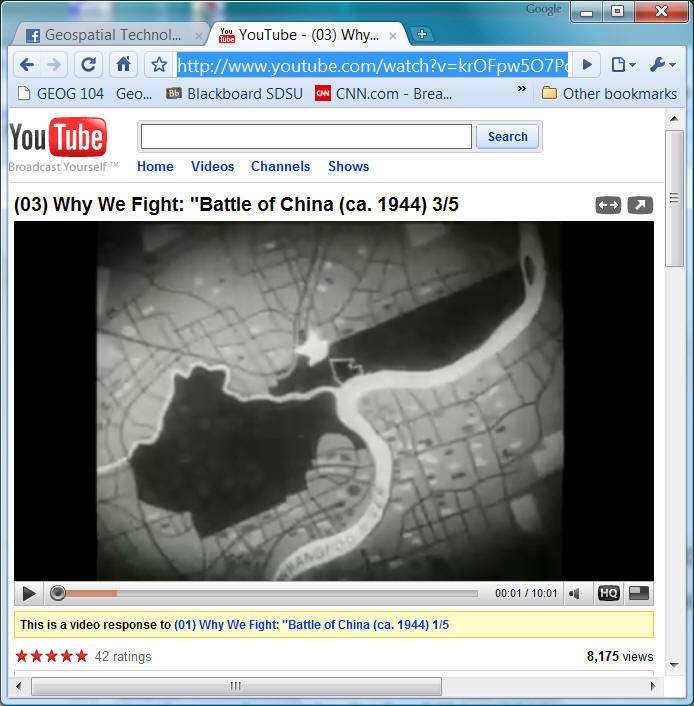
Early Example of Cartographic Animations (during World War II, Disney Studio):
http://maps.unomaha.edu/AnimArt/ActiveLegend/Peterson.html (created by Prof. Michael P. Peterson, Department of Geography / Geology, University of Nebraska at Omaha )
Another good example: Battle of China (1944)
http://www.youtube.com/watch?v=krOFpw5O7Pc&feature=response_watch
User Interactivity (Movies vs. Programs)
No Interaction: a movie (3D workstation, expensive to create).
NASA Animation Website: http://svs.gsfc.nasa.gov/index.html
Wilhelmson et al.’s depiction of thunderstorm development http://www.mediaport.net/fr/CP/CyberScience/BDD/fich_050.en.html
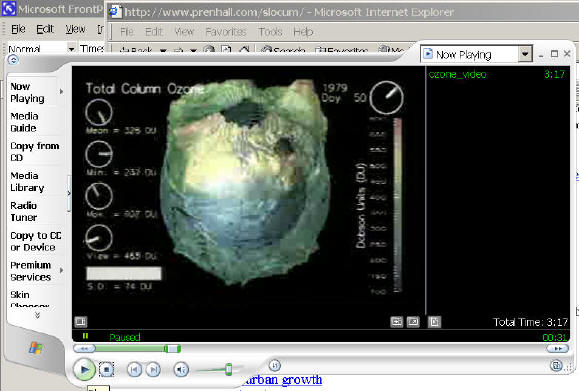
Treinish’s Climatology of Global Stratospheric Ozone http://www.research.ibm.com/people/l/lloydt/ozone_video.mpg
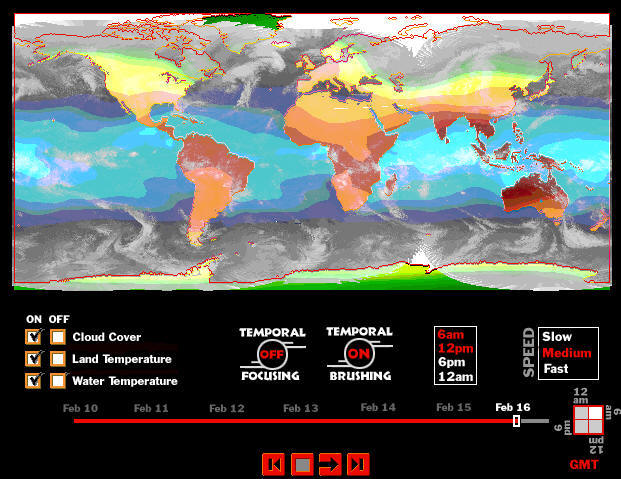
Interactive Animation Program (software programming + graphic tools):
Mark Harrow's Earth Systems Visualizer (Director software) http://www.geovista.psu.edu/grants/VisEarth/animations1.html
Visualization with Maps: (2D vs. 3D. vs. 4D)
2D Mapping:
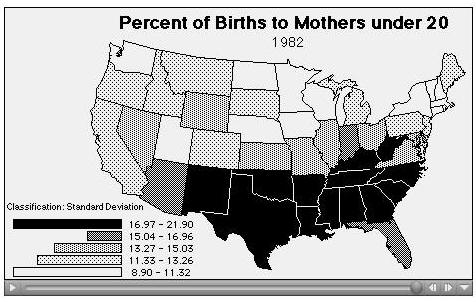
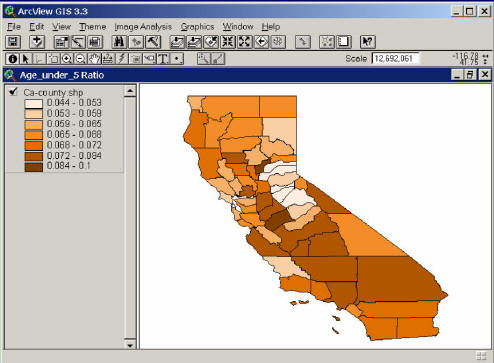
Choropleth Mapping:
The need for data standardization (normalization), in which raw totals are adjusted for differing sizes of enumeration units. (Administration units, like state or county boundary)
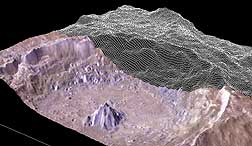
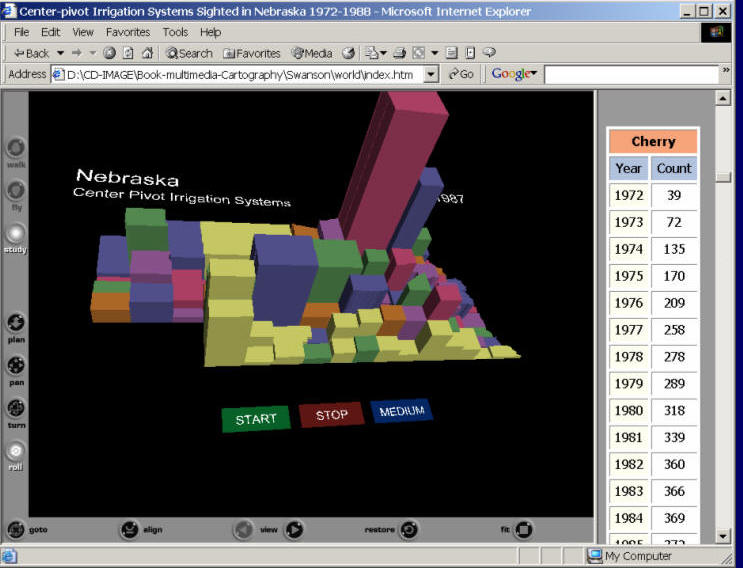
2.5 D Symbols (2.5 dimensional, Volume):
2 1/2 -D: a surface in which geographic location is defined by x and y coordinate pairs and the value of the phenomenon is the height above a zero point.
lack of true Z coordinate (replaced by the attribute values)
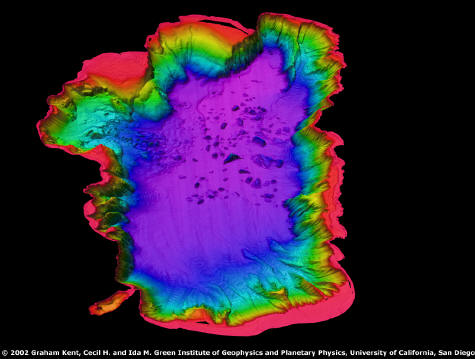
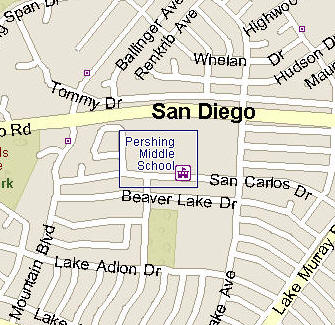
2.5 D San Diego Temperature Map
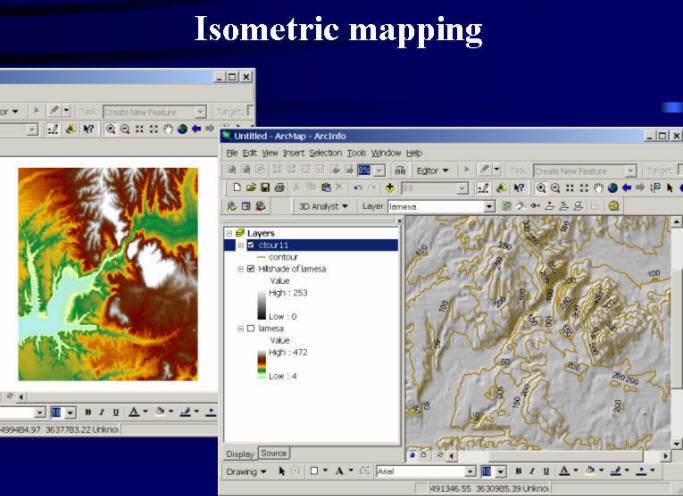
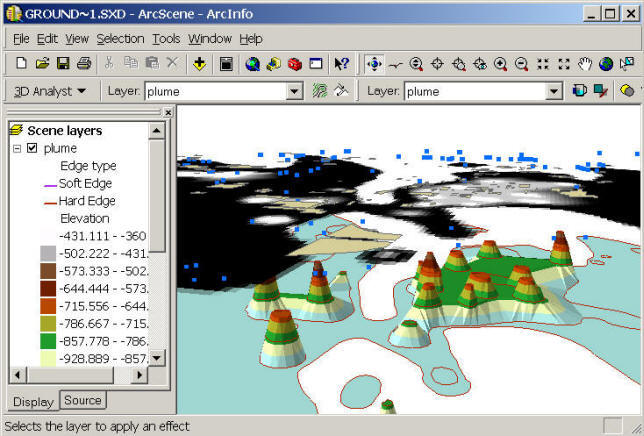
3D symbols and objects (Three-dimensional):
Any point on the surface is specified by four variables (X, Y, Z, and the values).
3D maps (usually mixed up with 2 1/2 maps)
Underground water quality
CO2 level in the atmosphere.
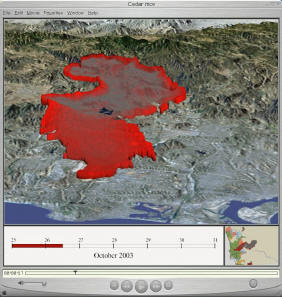
4D (Adding the Temporal Dimension)
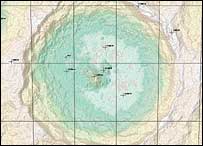
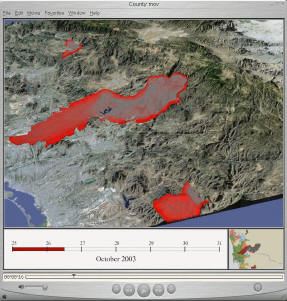
Animation (San Diego Wildfire animation) http://map.sdsu.edu
|
Fire Spread Animation Movies (created by Harry D. Johnson, Department of Geography, SDSU). Quicktime Movies (Require 6.5 or later version. Click here to download the Quicktime 6.5.1 player. http://www.apple.com/quicktime/download/standalone/ ) (Cedar Fire Animation) (San Diego County)
|
5D? 6D? 7D? (Other dimension ?)
Mental Map Exercise (Bonus two points)
Examples:
http://groups.ischool.berkeley.edu/mentalmaps/index.html
Unit-10 Questions:
1. Please select one Web mapping example for the purpose of geographic visualization and give a short introduction. What type of maps (2D or 3D or 4D) is it? What are their color scheme? What kinds of knowledge are provided by this visualization example.
![]()
![]()
![]()
This web site is hosted on MAP.SDSU.EDU
and Geography Department.
|
|