Satellite Images Overlay and Remote Sensing
NEW High Resolution Satellite Images from FORMOSAT-2 (Click HERE)
NASA MODIS Satellite Images: http://activefiremaps.fs.fed.us/imagery.php?op=fire&fireID=ca-south-000 (The MODIS images are the most useful satellite images for monitoring wildfires. MODIS (Moderate Resolution Imaging Spectroradiometer) is a senor instrument aboard the Terra (EOS AM) and Aqua (EOS PM) satellites. The images are updated twice per day (one shot from Terra and one shot from Aqua).
-
Animation of NASA MODIS satellite images Oct. 21-29, 2007 (by Ick Hoi (Rick) Kim) (True color -- Top picture, False color -- Second picture).
-
Archived individual pictures: True-color zip file, False-color zip file.
NASA MODIS Image Archive: http://modis.gsfc.nasa.gov/about/
(from Oct. 21, 2007 to Oct. 31, 2007)
-
MODIS-250m_ca-south-000_geo_tiffs.tar (50MB - original Geo-Tiff images)
-
modis_time_series.zip (11 MB)
-
-
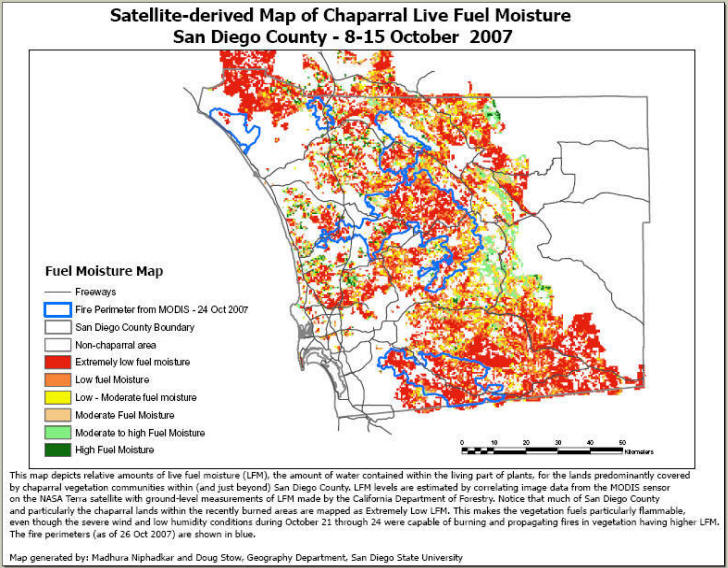
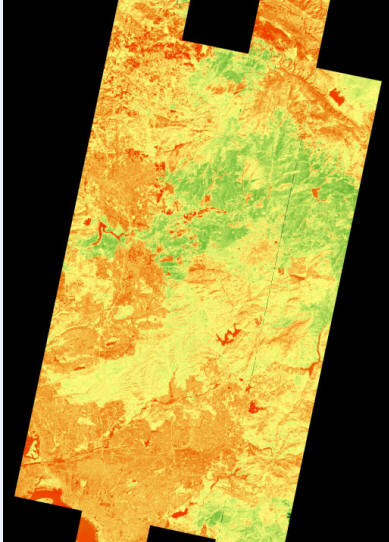
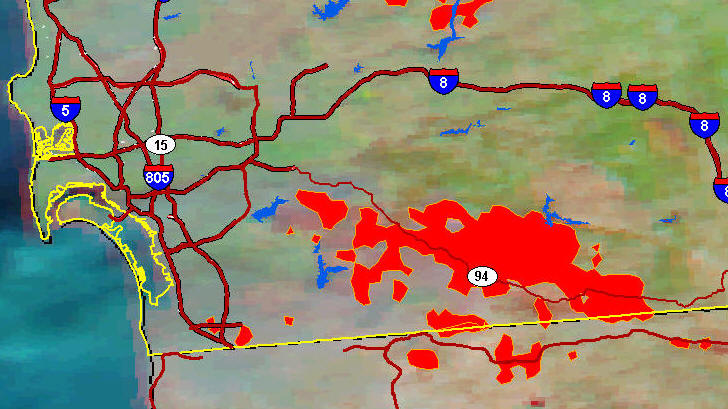
Fuel Moisture Map (created by Madhura Niphadkar and Doug Stow)
This map depicts relative amounts of live fuel moisture (LFM),
the amount of water contained within the living part of plants, for the lands
predominantly covered by chaparral vegetation communities within (and just
beyond) San Diego County. LFM levels are estimated by correlating image data
from the MODIS sensor on the NASA Terra satellite with ground-level measurements
of LFM made by the California Department of Forestry. Notice that much of San
Diego County and particularly the chaparral lands within the recently burned
areas are mapped as Extremely Low LFM. This makes the vegetation fuels
particularly flammable, even though the severe wind and low humidity conditions
during October 21 through 24 were capable of burning and propagating fires in
vegetation having higher LFM. The fire perimeters (as of Oct 24 2007) are shown
in blue.
Derived GeoData (SDSU)
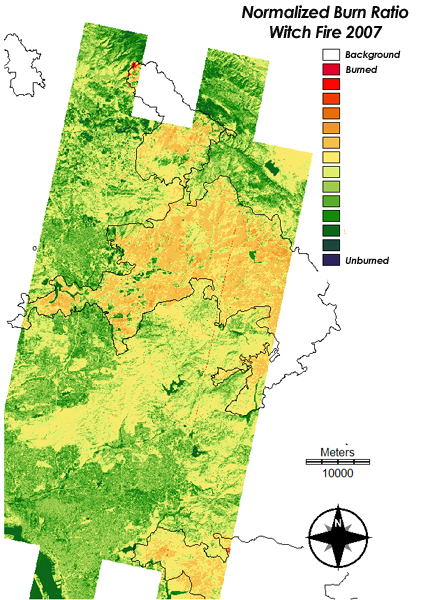
- Normalized Burn Ratio Index from EO-1 ALI
(30m) this morning (10/26)
 NBR_ALI_10262007.zip
(4mb JPEG)
NBR_ALI_1026.zip
(12mb TIFF)
created by Christopher
Lippitt and Doug Stow.
NBR_ALI_10262007.zip
(4mb JPEG)
NBR_ALI_1026.zip
(12mb TIFF)
created by Christopher
Lippitt and Doug Stow. -
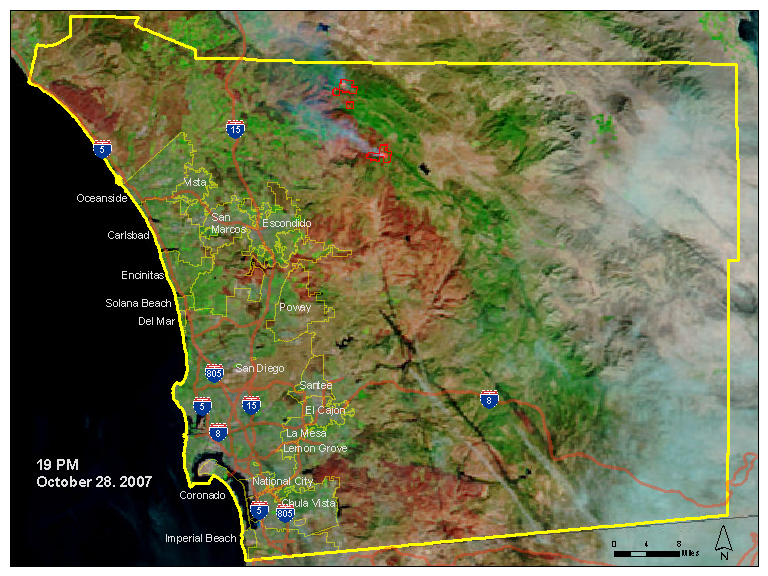
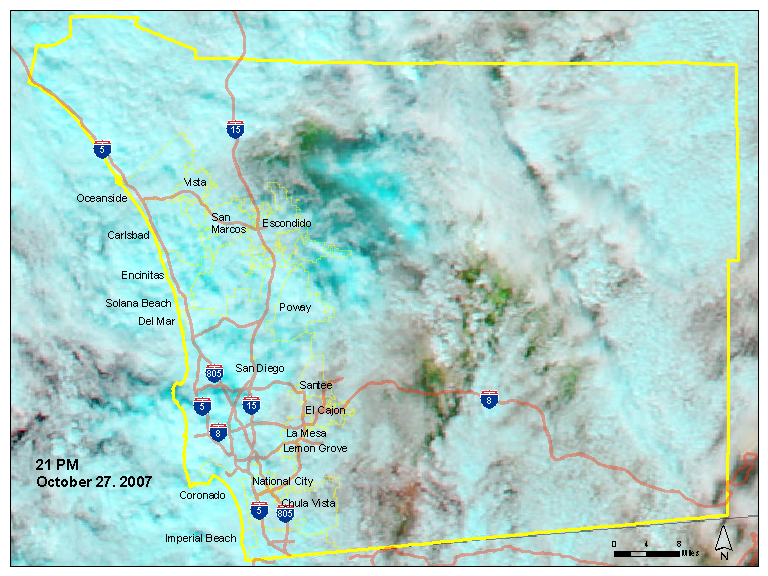
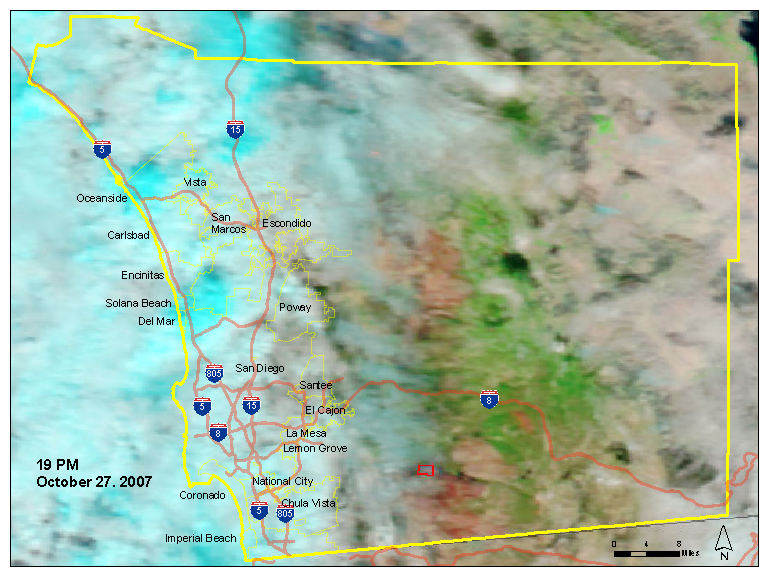
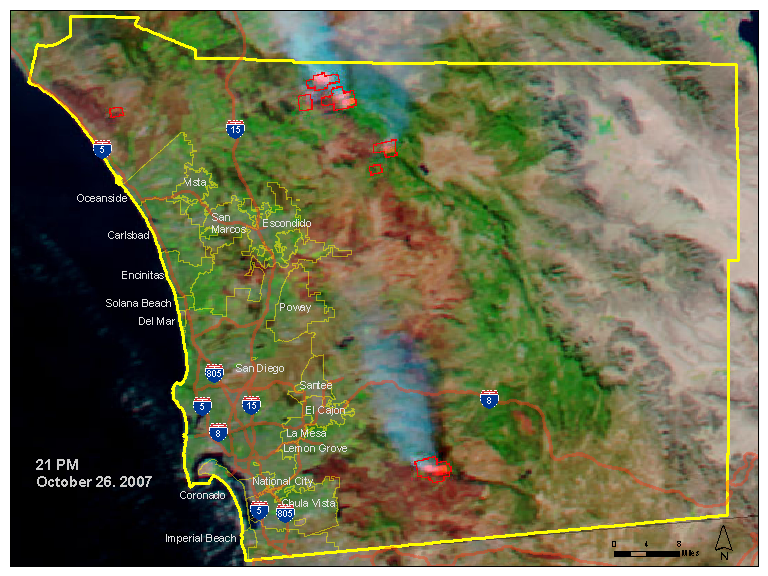
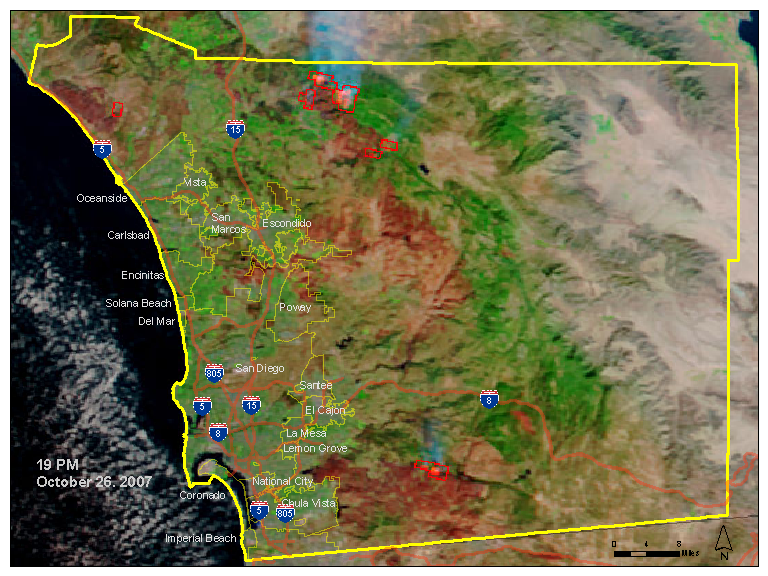
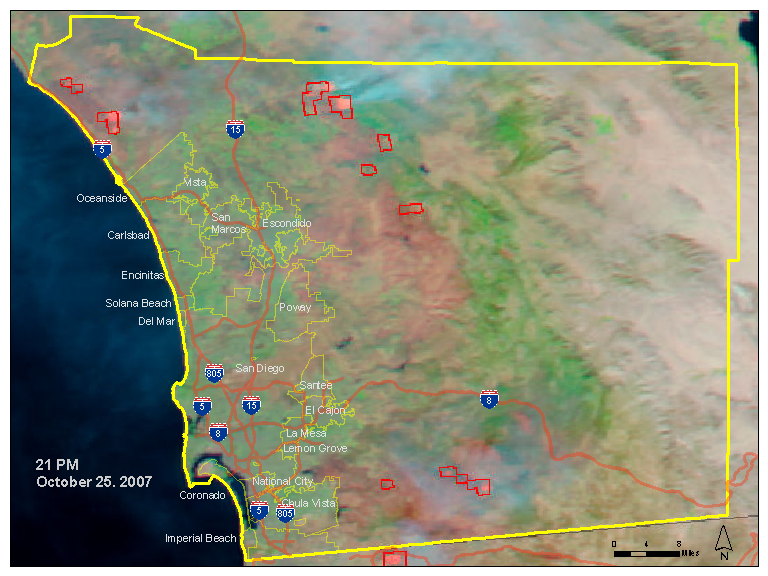
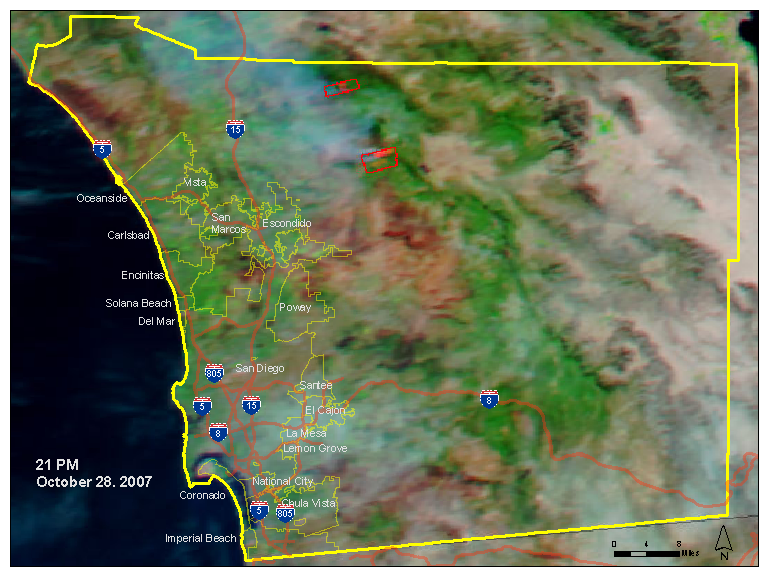
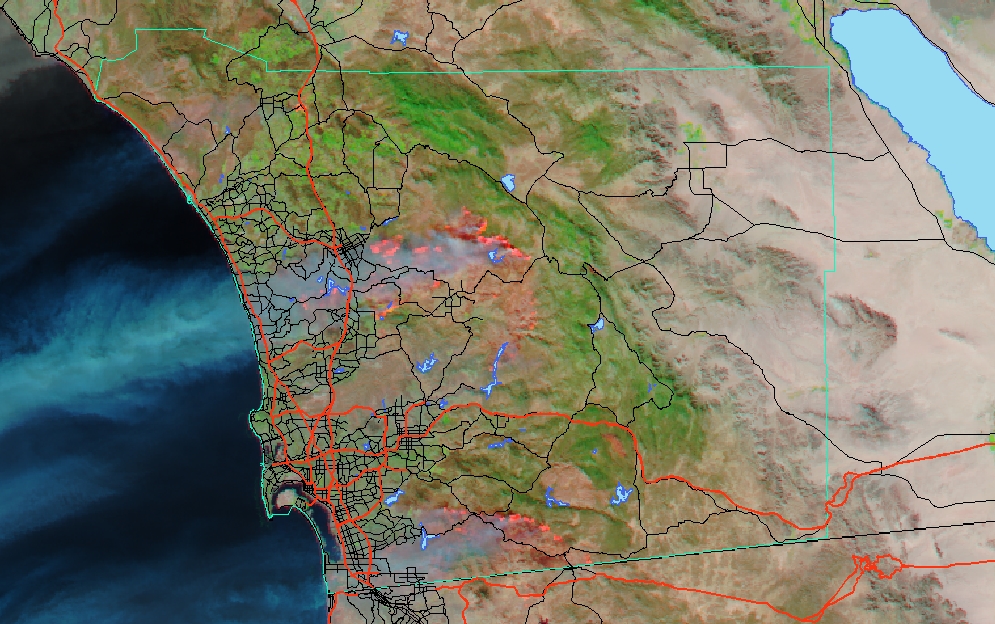
Archived MODIS images overlay with highways (Oct. 28 - 21 -- reversed order).(by Ick Hoi (Rick) Kim)

Satellite Images and Aerial Photos Links (compiled by Madhura Niphadkar)
- MODIS Rapidfire USA5 Subsets http://rapidfire.sci.gsfc.nasa.gov/subsets/?USA5
- Thermal Aerial Photos of Fire affected Areas http://www.fireimaging.com/homepage.html
- NASA's collection of Southern California fires images - includes Infrared aerial photos from Ikhana (unmanned research aircraft) http://www.nasa.gov/vision/earth/lookingatearth/socal_wildfires_oct07.html
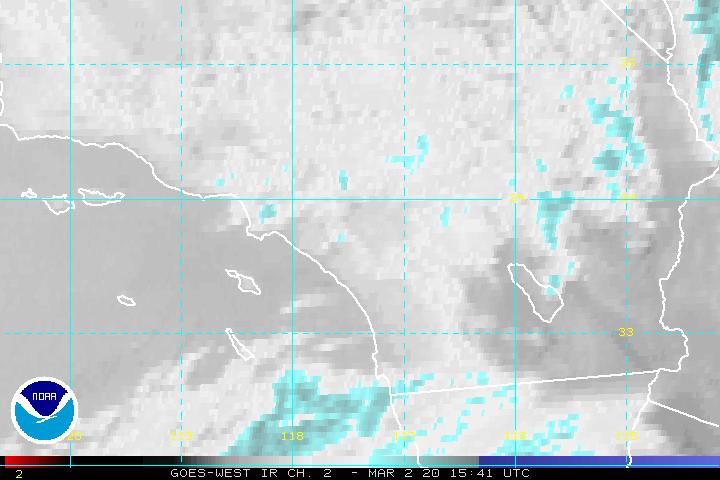
- GOES WEST satellite - Fire TOM IR Ch 2 - http://www.ssd.noaa.gov/goes/west/wfo/sgx/ir2-l.jpg
- GOES WEST - animation of GOES data http://www.osei.noaa.gov/Events/Current/CaliforniaFire.gif
- AIRS - Atmospheric Infrared Sounder from MODIS Aqua showing smoke plumes - http://photojournal.jpl.nasa.gov/catalog/PIA10088
- SSD _Satellite Services Division - for Oct 24, 2007 - Smoke plume outside of So Cal. http://www.firedetect.noaa.gov/viewer.htm
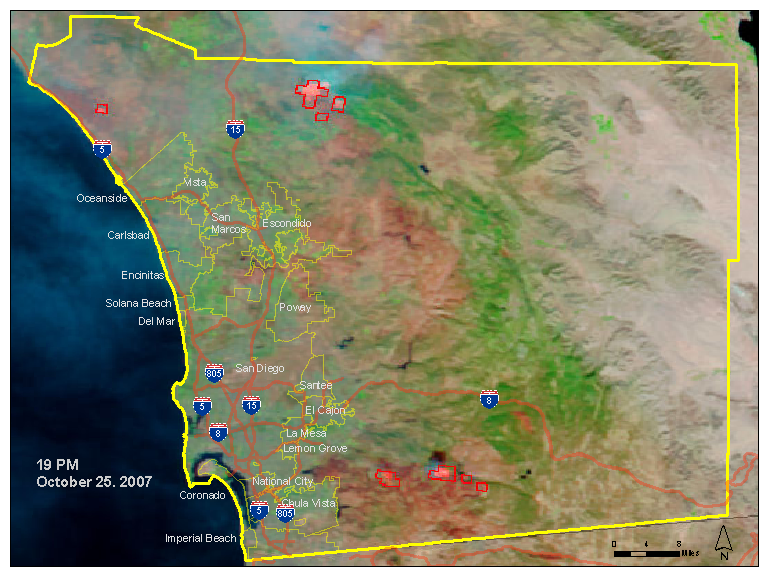
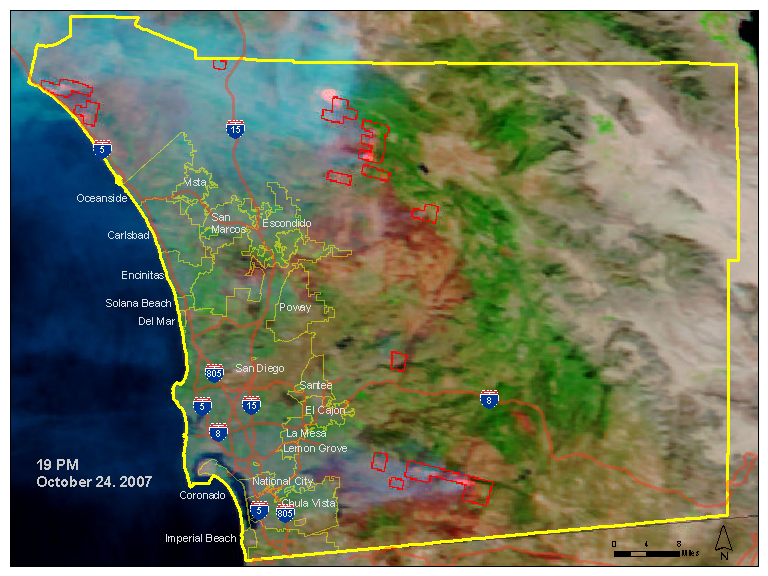
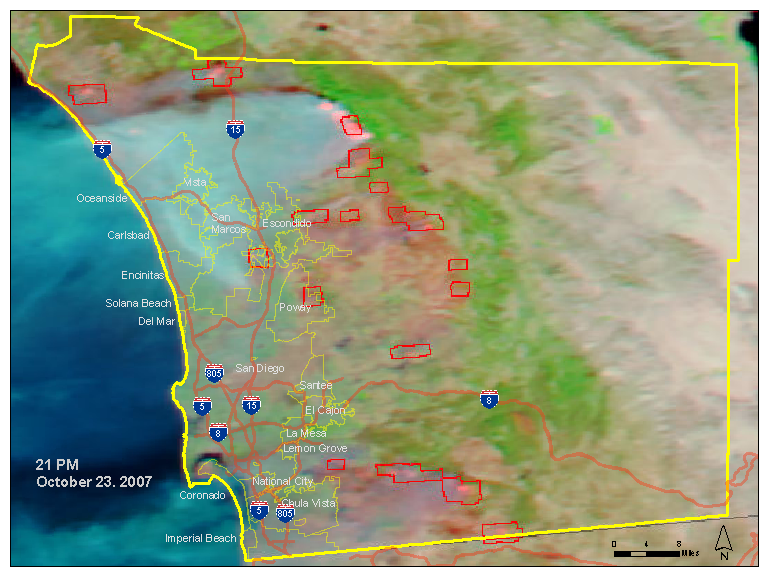
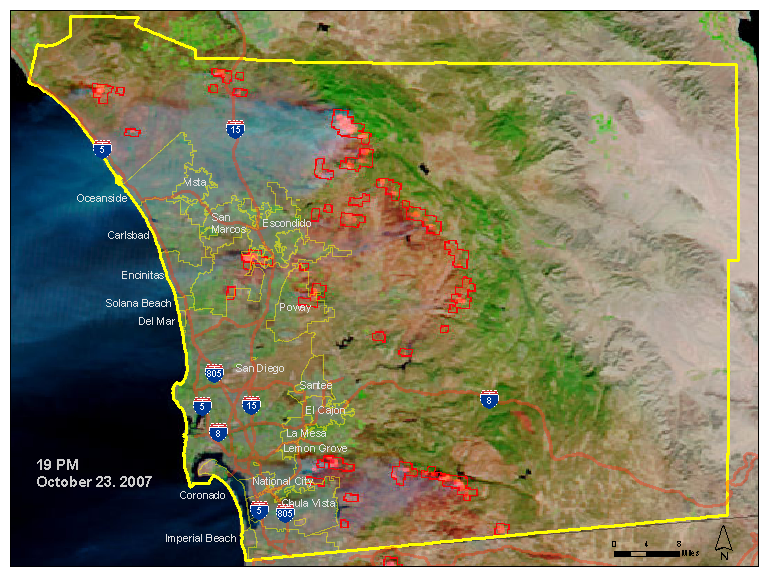
Archived Satellite Images and Overlay Maps. (Oct. 21-24)
-
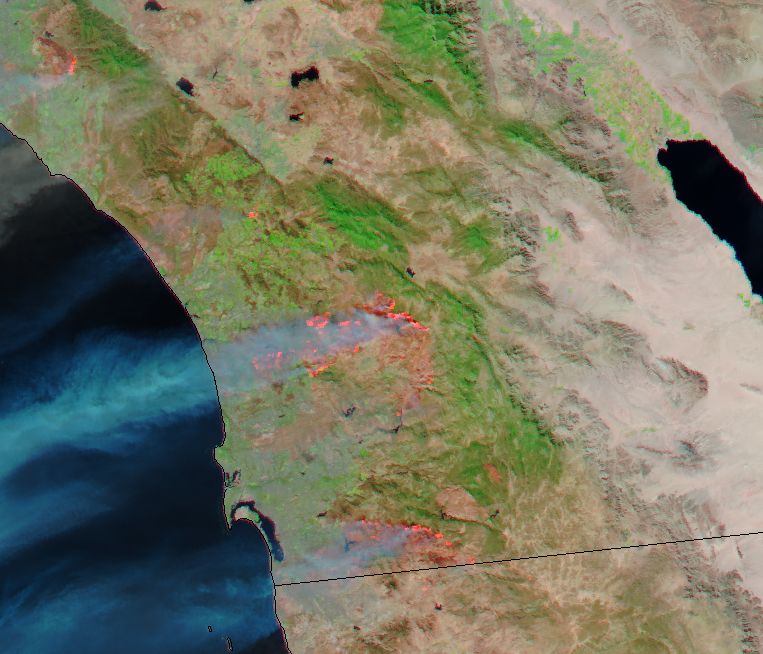
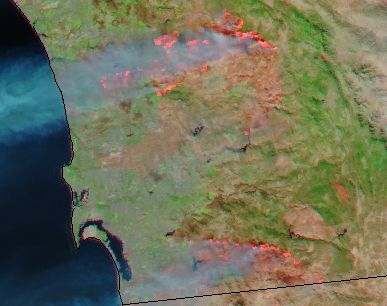
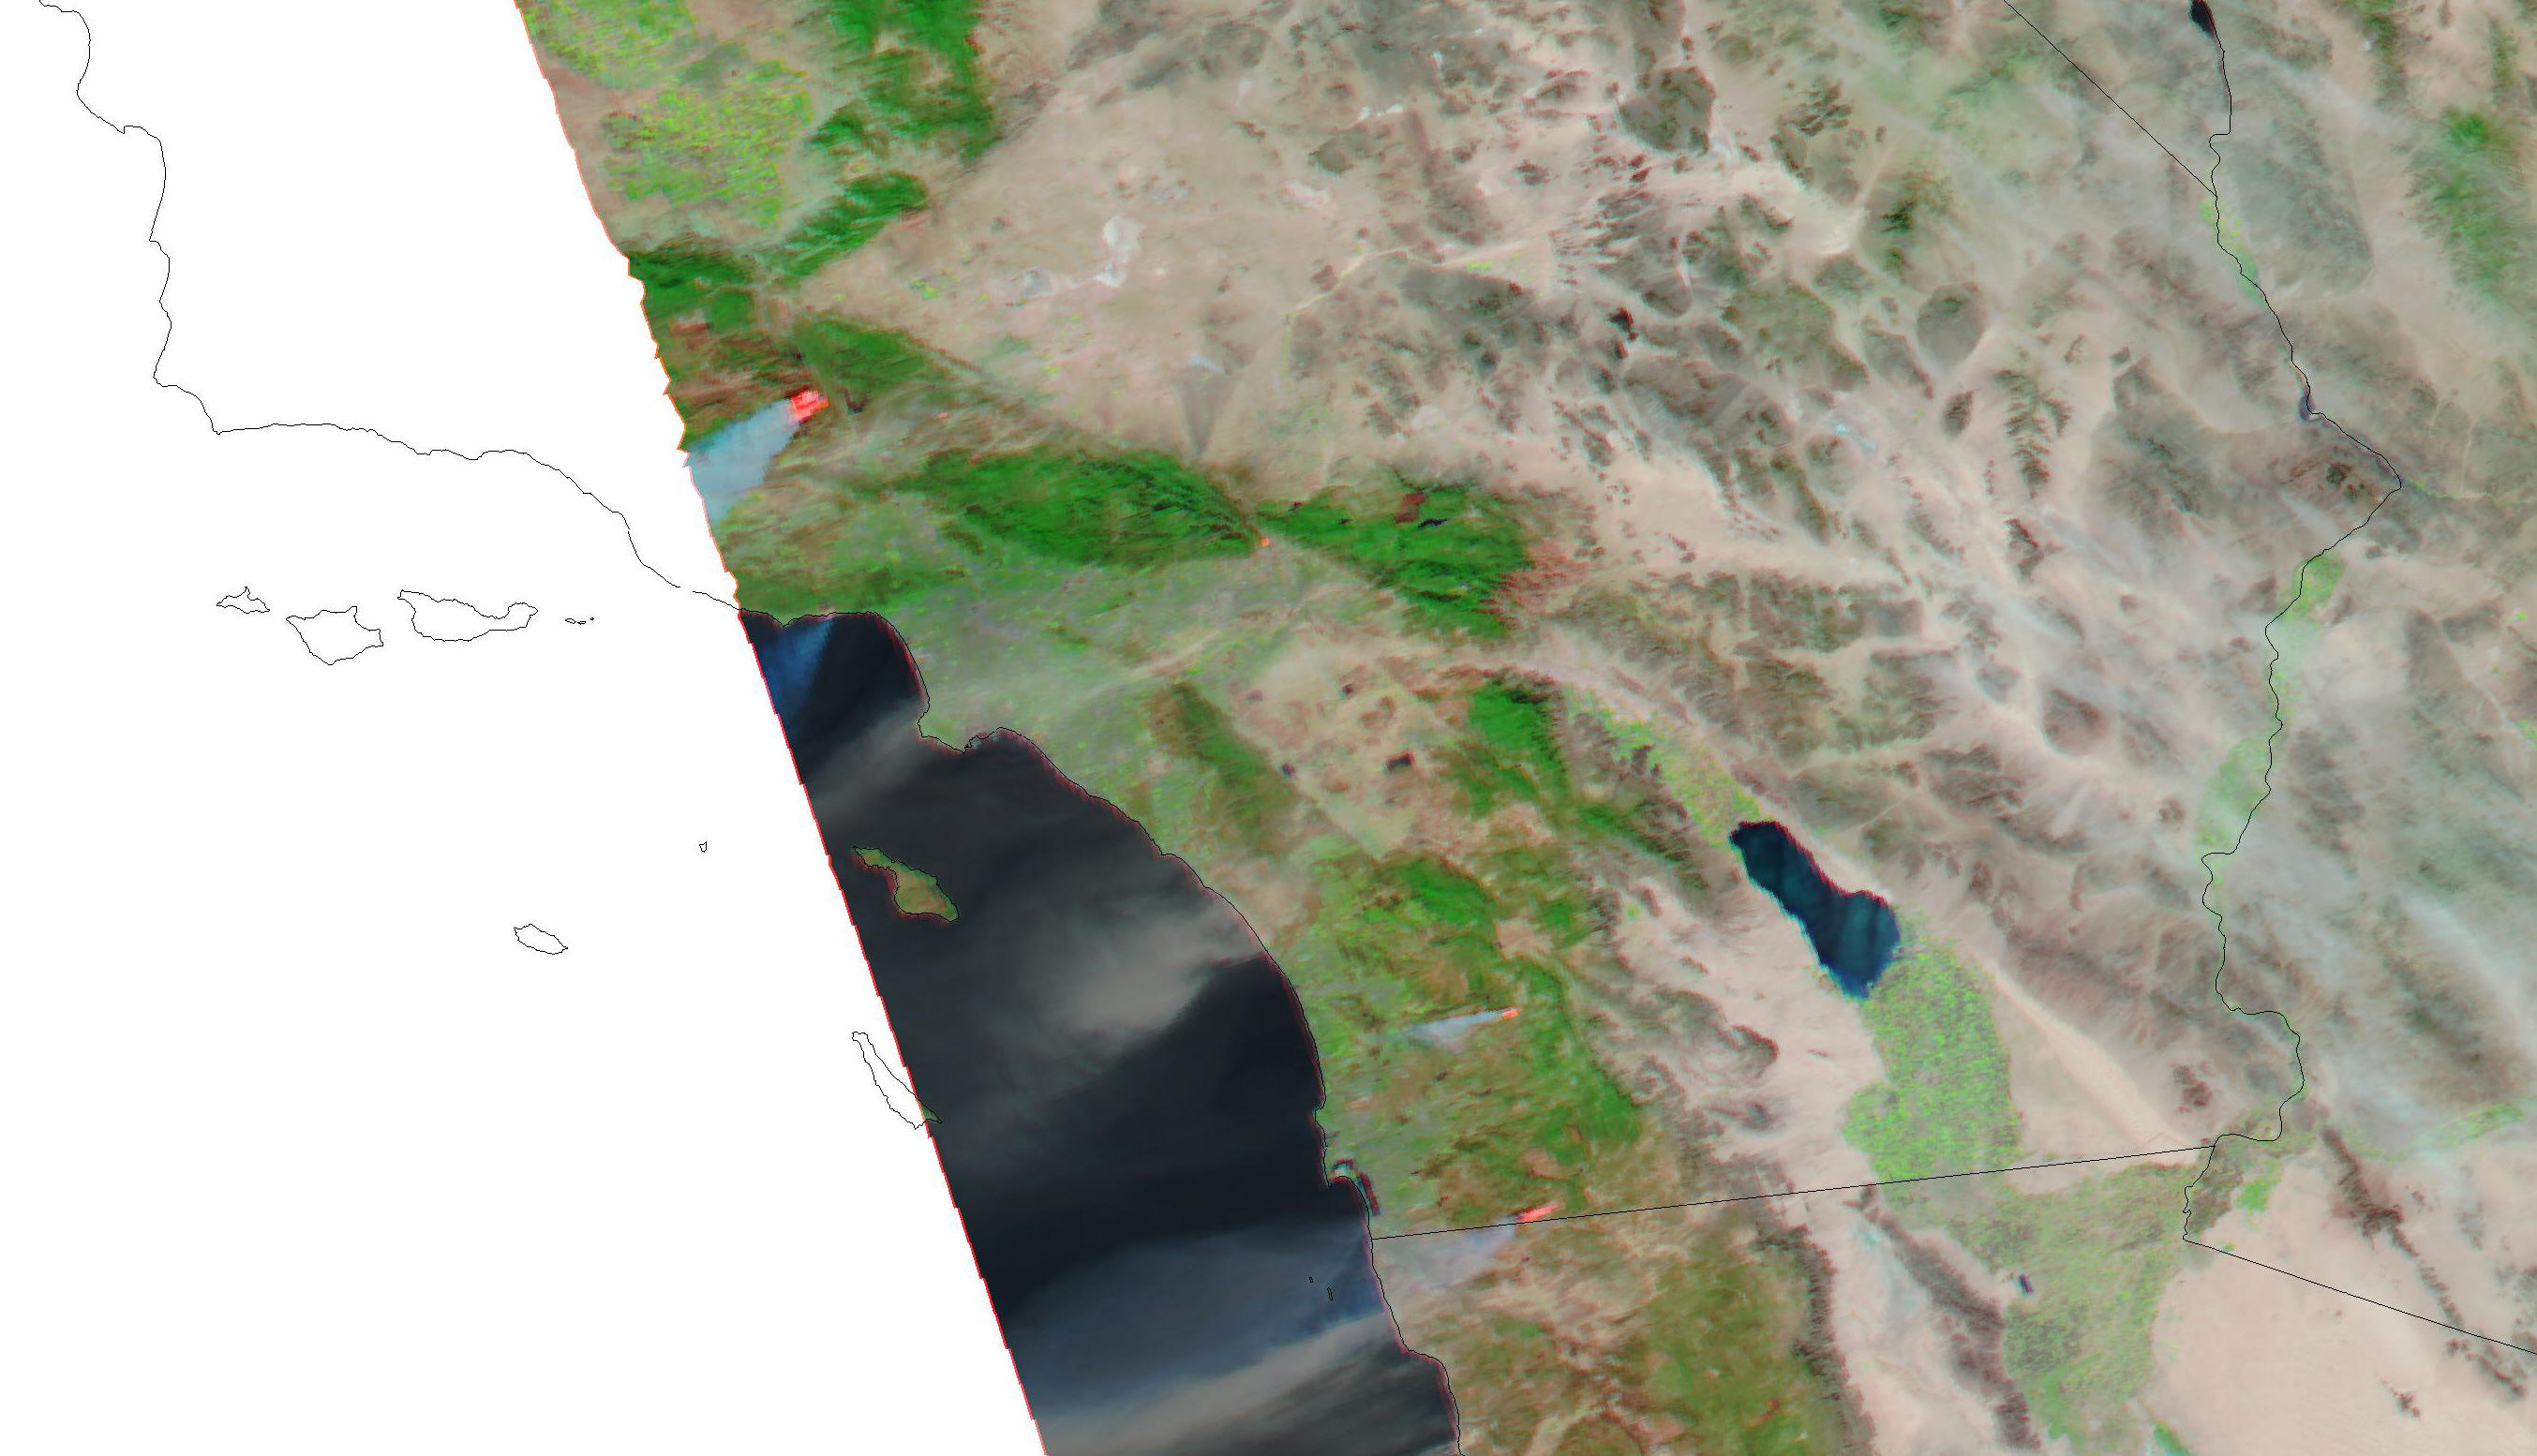
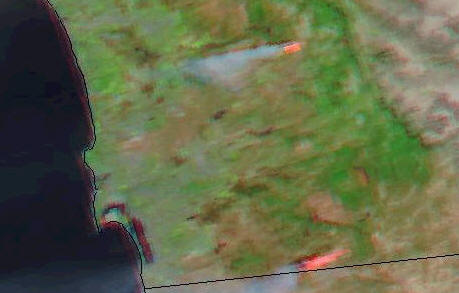
10/23/2007 21:38:18 GMT NASA Satellite: Aqua (San Diego Time: Oct. 23, 2:38pm)
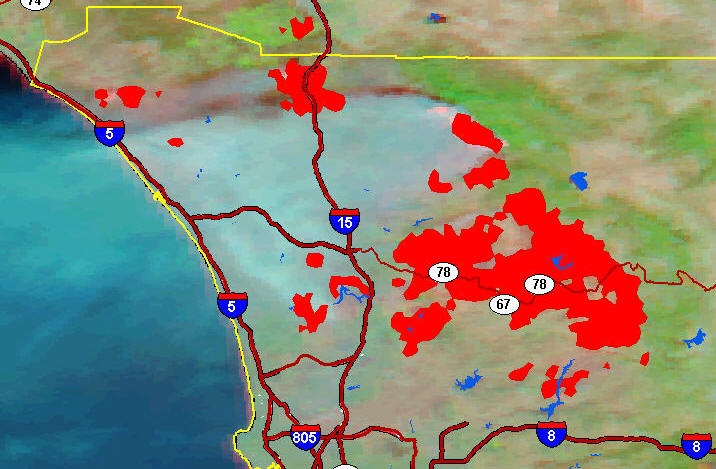
(False Color -- Easier to see the fire perimeters).
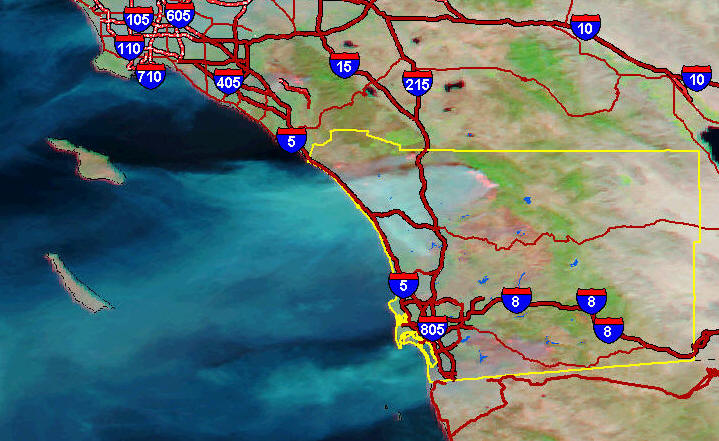
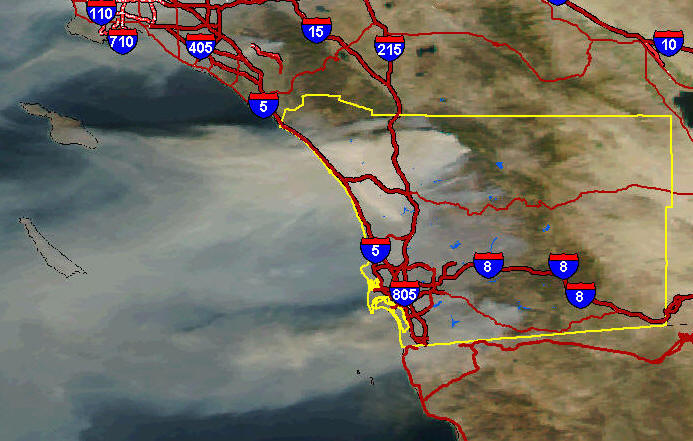
(True Color: showing smokes)
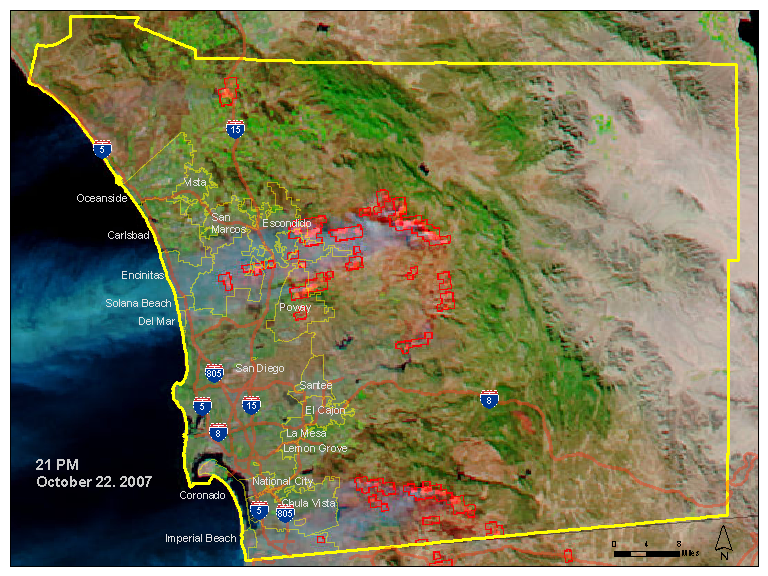
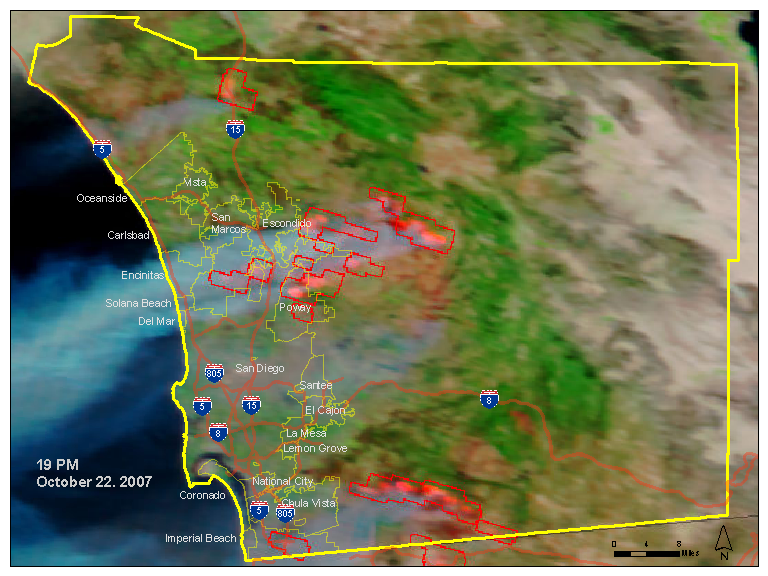
MODIS image -- overlay with fire perimeters.
Oct. 22, 2007
Modis imagery update 22 October 2007 1:00pm
(Note: Currently (Oct. 22 7:00AM), both Witch Creek Fire and Harris Fire are much worse than last night. Our Geography Department staff will continue to update these wildfire maps once we get new information. --- Ming Tsou.
-
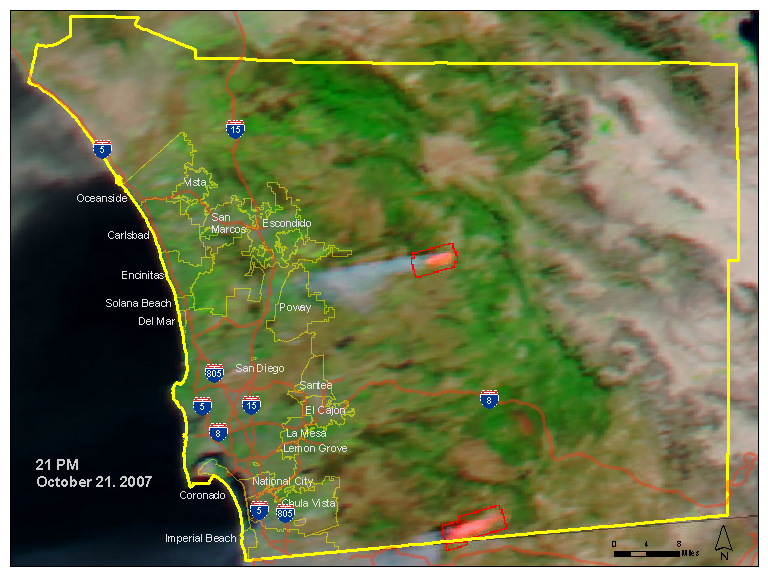
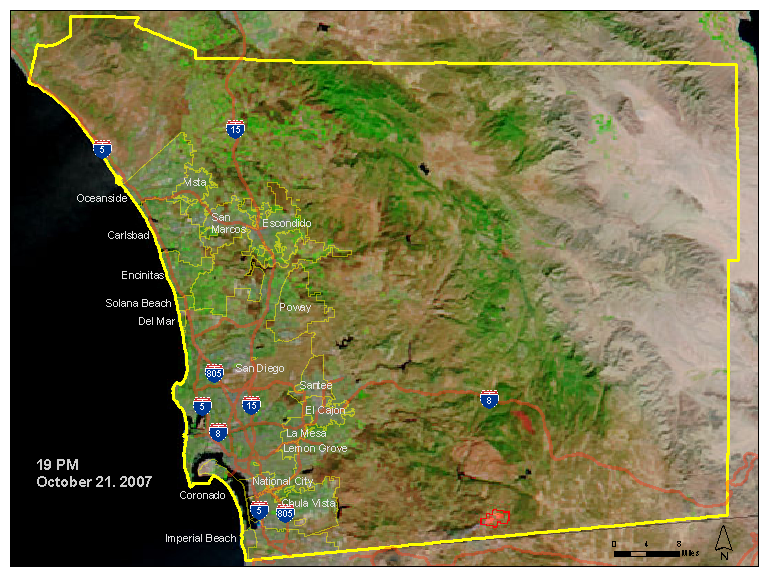
Oct. 21, 2007
The following links are
the PDF maps for updated fire perimeters (Witch Fire and Harris Fire)
(PDF fire perimeter maps update from the San Diego County - link
source from
SignonSanDiego Weblog:
-
http://www.signonsandiego.com/news/metro/images/071021harrisfireperimetermap.pdf
-
http://www.signonsandiego.com/news/northcounty/images/071021-2245-witchfiremap.pdf
-
(created by SanGIS and California OES).
Access Satellite Images (MODIS): 10/21/2007 1:00pm in Pacific Time Zone
http://activefiremaps.fs.fed.us/imagery.php?op=fire&fireID=ca-south-000
Images from USDA Forest Service Remote Sensing Application Center
10/21/2007, 20:11:18 GMT (equal to 10/21/2007 1:00pm in Pacific Time Zone).
Satellite: Aqua
(Note: the MODIS images in USDA website are updated daily).
GeoMAC (USGS) Wildfire
Mapping Services
http://geomac.usgs.gov/viewer/viewer.htm
(Usually updated daily. Currently, the new wildfires in San Diego have not been shown in their maps yet.
Oct. 21, 11pm.--Ming)
San Diego State University, Department
of Geography Department
provides the following mapping services:
(Disclaimer: Since all GIS layers in these mapping services are derived from external resources, SDSU and the Department of Geography are not responsible for the accuracy of these information.
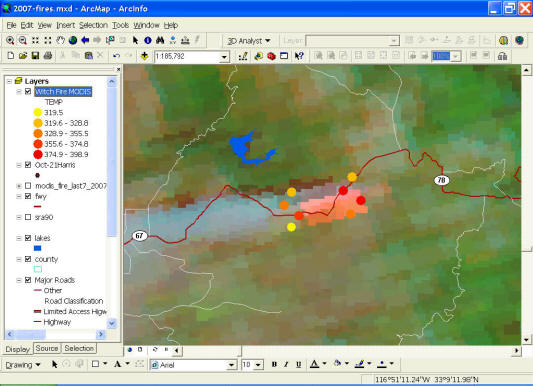
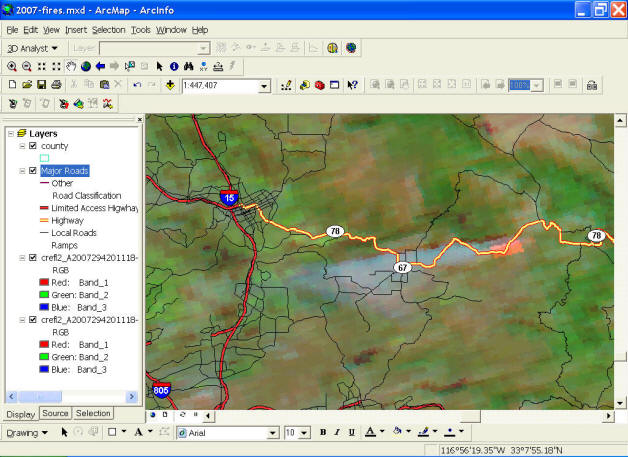
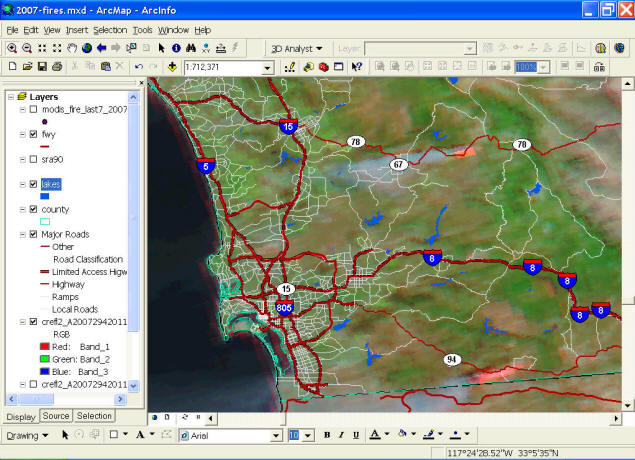
The Witch Fire (Top) and the Harris Fire (Bottom), (Oct. 21 1:00pm PCT)
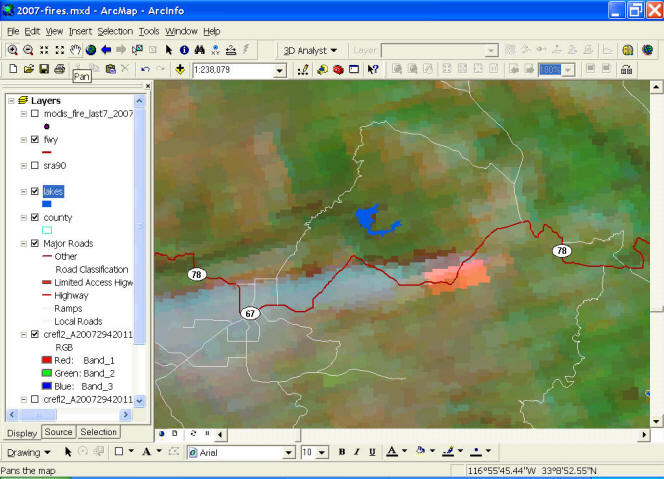
The Witch Fire (Oct. 21 1:00pm PCT)
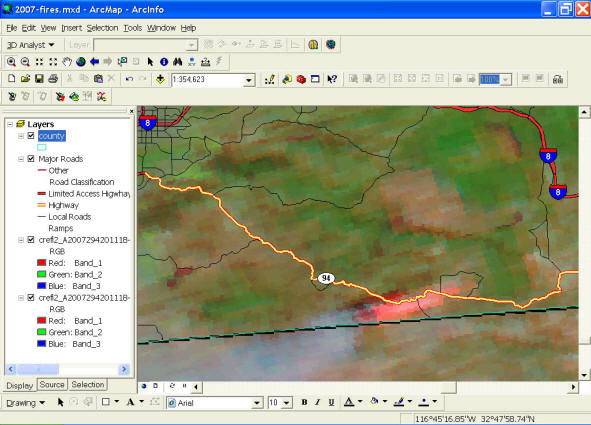
The Harris Fire
The Witch Fire (Top) and the Harris Fire (Bottom), (Oct. 21 1:00pm PCT)
The Witch Fire (Oct. 21 1:00pm PCT)
The Harris Fire (Oct. 21 1:00pm PCT)
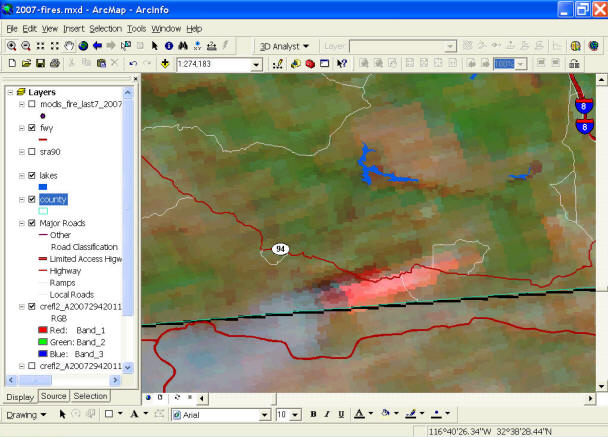
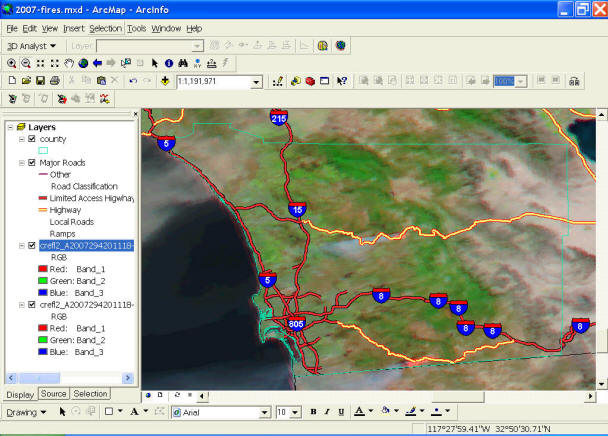
For GIS professionals, you can create similar maps by downloading the following GIS data:
The MODIS GeoTIFF images (GeoTiff images are already georeferenced).
http://activefiremaps.fs.fed.us/imagery.php?op=fire&fireID=ca-south-000 (download the GeoTIFF compressed file. Decompress it, then overlay with GIS layers -- also can be downloaded from SANDAG website: http://www.sandag.org/index.asp?subclassid=100&fuseaction=home.subclasshome (Shapefile format).
Also, for the more updated MODIS GIS data (points), link to http://activefiremaps.fs.fed.us/fireptdata/modisfire_2007_conus_last7.htm
The MODIS satellite data showing the ground temperature (K degree). (Oct. 21, 1pm) -- Ming)