|
| |
Map Explanation and Directions:
- Click Here To View Map
Please refer to the ArcIMS User’s Manual's section on Using the Java
Viewers for detailed instructions. The guide can be obtained at
www.esri.com
The map shows which sections of open spaces were converted to other land-uses
from 1995 to 2003 in San Diego County. There are five different kinds of open
space layers. They are displayed in the legend with a check box next to them and
are called Beaches, Landscape Open Space, Open Space Reserves, Residential
Recreation, and Parks. Please, refer to the proper link for definitions of the
different kinds of open spaces. If you click on a layer, a box will form around
all the features that are in that layer. Each feature is represented by a color.
The features represent all the different kinds of land-use classes and are the
same for all five kinds of open spaces. For example, dark green represents parks
in all five open space layers.
The legend can be simplified by reducing each layer except for the Parks Layer,
so only the colors under the Parks Layer are displayed in the legend. Note: the
Parks Layer contains all the colors representing the different land-use classes.
To reduce a layer right click on it and uncheck Display Layer Classification.
The map of San Diego Land Use is actually made up of five different maps, one
for each open space type. So, in order to avoid confusion only one layer should
be active or turned on at a time. Layers can be turned off and on by checking
and unchecking the box next to the layer name. There are other layers of roads,
lakes, the county boundry, etc. which can also be turned off and on. When
viewing an open space layer the colored polygons represent the areas, for that
particular type of open space, which were converted into other land-uses. The
color of the polygon represents the class of land-use that area of open space
was converted into. If more than one open space layer is viewed at a time then
you will not be able to tell the difference between the different open space
conversions, because they all use the same colors for land-use classes.
After you have prepared your map it should look like this:
   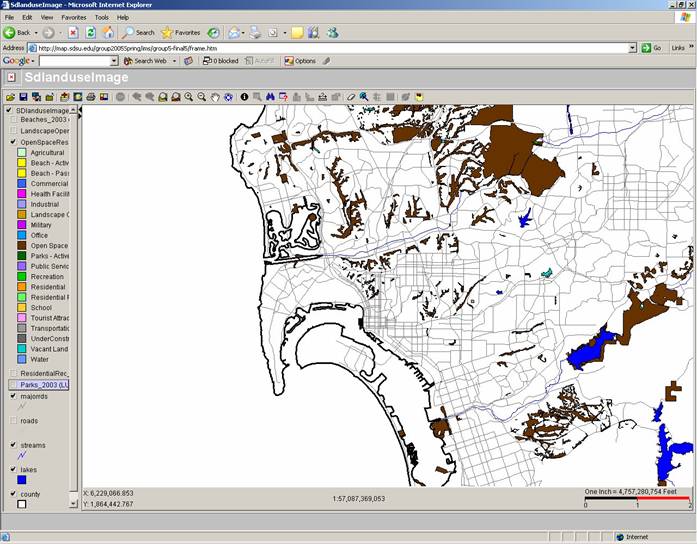
Areas of interest can be zoomed
into, to see more detail. Use the mouse to click on and activate the zoom
tool in the toolbar. The zoom tool looks like a magnifying glass with a
plus sign in the middle of it. Use the mouse to click and drag a box
around the area you want to zoom into. For example, I zoomed into the area in
the red box in the image above. Below is the zoomed in area:
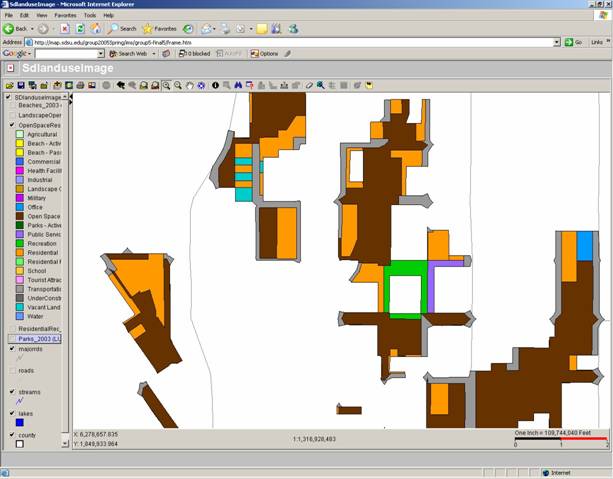
The conversion of open space into
other land-use classes is very apparent. In 1993 all of the colored polygons
were open space reserves. In 2003 all that remains of the open space reserves
is shown in brown. Much of the open space reserves in this area were converted
to residential use in orange, such as apartments and houses. The gray areas
indicate the construction of transportation areas, such as roads and parking
lots. The teal areas have been converted into vacant land, indicating they can
be developed. Near the center of the image a public service building in purple
was built next to a residential park in green. Even an office space, in blue,
was built on a open space reserve. Clearly these open space reserves are not
very well protected. All that is left of the open space reserves are fragmented
little pieces of wilderness that can not support many forms of native wildlife.
|
![[Company Logo Image]](TerraGeospatialLogoSmall.jpg)