GEO 583 Internet Mapping and Distributed GIServices
![]()
![]()
![]()
![]()
Unit SEVEN (Session One):
Group Project Proposal (five minutes each group)
![]()
![]()
Eagle or Letter?

Visualization
For a long time, visualization was treated as a powerful tool and approach to represent and explore the scientific and nature phenomena. The same situation also happens in geographical research and GIS. As Buttenfield and Mackaness (1991, p.427) indicate, "Visualization is an important component of any effort to understand, analyze or explain the distribution of phenomena on the surface of the earth, and will become increasingly important as volumes of digital spatial data become more unmanageable." The GIS communities also attempt to develop improved products to "support for complex analytical application, including tracking of data lineage, tools for visual interaction with the stages in the analysis process, propagation of uncertainty" (Rhind, Goodchild and Maguire, 1991, p.320). The content of visualization is very broad, including human cognition, analysis of scientific or physical data, computer graphic display and so on. The following definition of visualization by Buttenfield and Mackaness (1991, p.432) is more sophisticated and complete:
Definition: Visualization is the process of representing information synoptically for the purpose of recognizing, communicating and interpreting pattern and structure. Its domain encompasses the computational, cognitive and mechanical aspects of generating, organizing, manipulating and comprehending such representations. Representations may be rendered symbolically, graphically, or iconically and are most often differentiated from other forms of expression (textual, verbal, or formulaic) by virtue of their synoptic format and with qualities traditionally described by the term 'Gestalt'. (Buttenfield and Mackaness, 1991, p.432)
Penn State GeoVista Center Animation Examples:
http://www.geovista.psu.edu/index.jsp
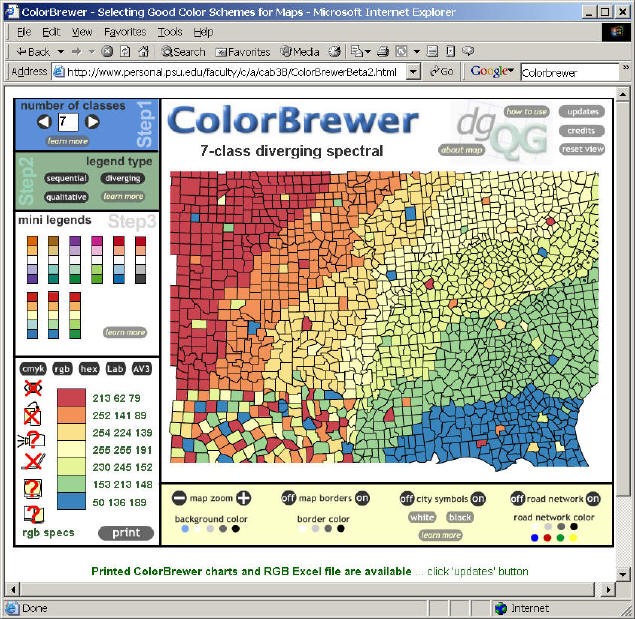
ColorBrewer Example: (Developed by Dr.
Cynthia A. Brewer and Dr. Mark Harrower)
http://www.personal.psu.edu/faculty/c/a/cab38/ColorBrewerBeta.html
![]()
Contemporary research on visualization is mostly dominated by the computer science community. Those research efforts usually focus on the physical objects or nature phenomena. Roth (1994, p.6) indicates that "Very little research has addressed the information access, exploration and analysis." He also suggests that the larger population of "information specialists" should be involved with the development of visualization research. Roth presents five essential points to be the guidance for future visualization research. Those points are also very appropriate to apply in GIS related research:
1. Flexibly provide visualizations for unpredictable combinations of diverse relational and quantitative information,
2. Do not require programming expertise or lengthy visualization design and setup work that detracts attention from a user's primary task,
3. Provide automated visualization design expertise to support rapid perusal, as well as interactive and automatic construction of displays,
4. Provide interactive information manipulation capabilities that reflect the task people perform, and
5. Coordinate visual and textual presentations of information.
Recent visualization research usually focus on the visualization of physical data. Visualization methodologies have not maturely developed in GIS. Therefore, there are still many argument and debates in the topic of visualization in GIS. Knapp (1994) states that the three levels of integration between GIS and Scientific Visualization Systems (SVS) have been identified as rudimentary, operational and functional.
"At a rudimentary level data can be passed from a GIS to a SVS or vice versa, often saving extensive reformatting time. The main issue with this level of integration is redundant data, sequential processing, a dual system interface, and the lack of new functionality relative to analysis of n-dimensional data.
An operational level of integration, which allows real-time data passing removes the data redundancy issue but introduces a potential performance problem, depending on the size of the data set and available compute power.
Fully Integration at a functional level holds the most potential for iterative and interactive analysis and visualization. Such a system would extend the visual programming concepts of SVS to include GIS function, extend GIS analytical operations to three and four dimensions, and provide a single interface to environmental scientists." (Knapp, 1994, p.401)
San Diego Super Computer Center Visualization Group http://vis.sdsc.edu/
SDSU Visualization Center: http://map.sdsu.edu/visual
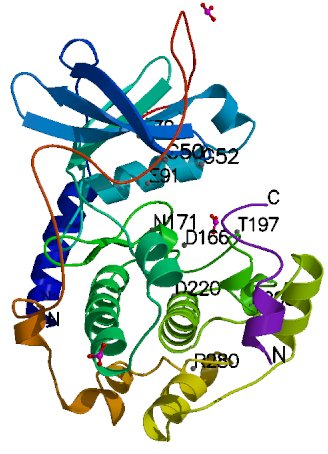
MICE: view interactively three-dimensional models of molecules (source: http://vis.sdsc.edu/research/mice.html
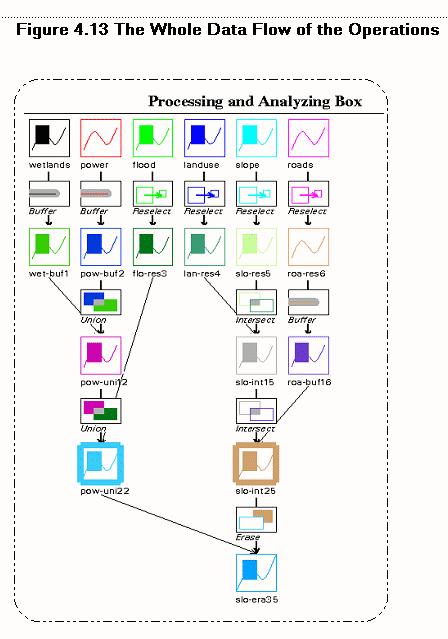
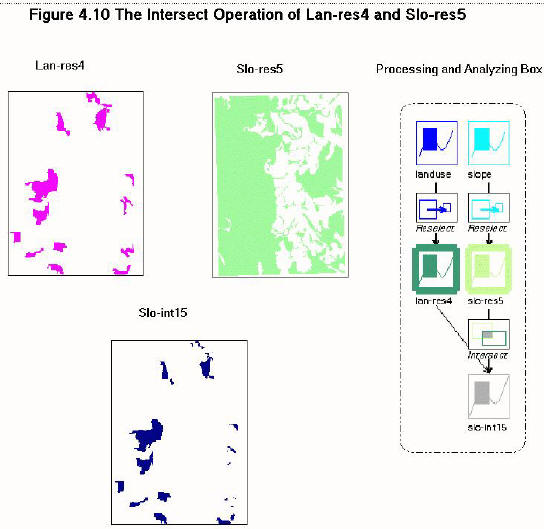
However, there are some differences between visualization of information and the visualization of information processing and analysis.
Visualization of Information
visualization of information processing (Visual programming)
Owing to the necessity of visualization research, researchers from many various sectors have begun to explore the issue of visualization in GIS. These people include commercial GIS companies, academic communities, and federal research institutions. For example, U. S. Environmental Protection Agency provides excellent hardware and software support for the research in the integration of visualization and GIS methods. Those research results may improve the decision-making process and minimize economic constraints associated with the purchase, training and maintenance of redundant closed systems (Rhyne, et al., 1994). The National Center for Geographic Information and Analysis (NCGIA) also closed the Research Initiative 7: Visualization of Spatial Data Quality (Beard, Buttenfield, and Clapham, 1992). Now, there are many related research projects among the GIS community. Future visualization research in GIS will be based on a very broad scope.
Currently, one of major geo-visualization research projects is carried by Dr. Alan M. MacEachren and his colleagues at the Department of Geography, the Penn State University. Dr. MacEachren identify a few primary research themes in Geovisualization:
| Representation of geospatial information | |
| Integration of visual with computational methods of knowledge construction, | |
| Interface design for geovisualization environments, and | |
| cognitive/usability aspects of geovisuaization. |
(Source: MacEachren and Kraak, 2001, Cartography and Geographic Information Science. vol28, no.1, 2001)
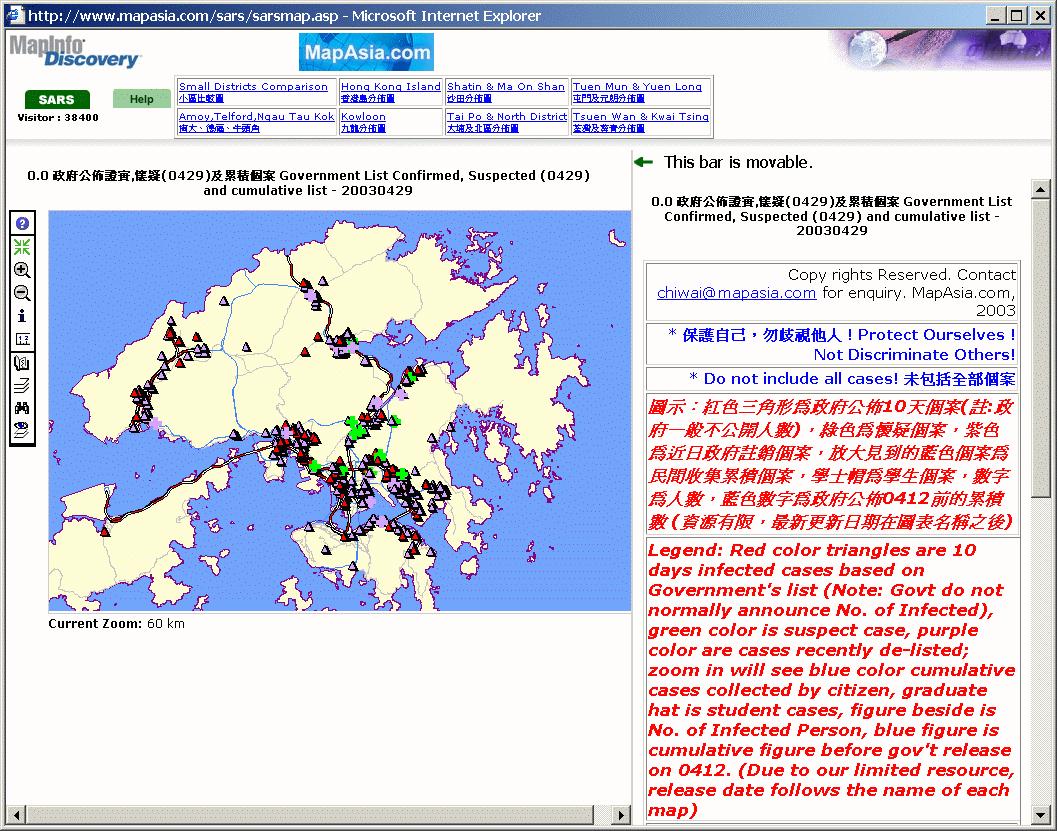
SARS http://www.mapasia.com/sars
Related Link:
| The 12th annual IEEE Visualization conference http://vis.computer.org/ | |
| GeoVISTA is the Penn State Geographic Visualization Science, Technology, and Applications Center http://www.geovista.psu.edu/ | |
| The GIS-VIS project: a joint effort of U.S. EPA's Scientific Visualization Center and the Unix/VMS/GIS Technical Support Group. http://www.epa.gov/gisvis/ |
What's the connection between visualization and Internet mapping?
1. Internet mapping can improve the accessibility of Visualization tools. Traditional visualization software are expensive and difficult to use. Web browsers could become the free tools or viewer for visualization.
2. Visualization can be applied for navigating information landscape and World Wide Web and for solving the "information overload" problem on the Internet.
3. The display and result of visualization research can be published on the Web and facilitate the exchange of the knowledge of visualization research with the scientific community.
4. Others....?
On-line Web Application:
www.terrafly.com by The High Performance Database Research Center (HPDRC) which is associated with the School of Computer Science at Florida International University.
![]()
Human Computer Interaction (HCI) and User Interface Design
![]()
What is Human Computer Interaction (HCI)?
Human-computer interaction is a discipline concerned with the design, evaluation and implementation of interactive computing systems for human use and with the study of major phenomena surrounding them.
(source: Curricula for Human-Computer Interaction (ACM SIG CHI) http://www.acm.org/sigchi/cdg/cdg2.html#2_1 )
	N	The Nature of HCI
		N1	(Meta-)Models of HCI
	U	Use and Context of Computers
		U1	Human Social Organization and Work
		U2 	Application Areas
		U3 	Human-Machine Fit and Adaptation
	H	Human Characteristics
		H1 	Human Information Processing
		H2 	Language, Communication, Interaction
		H3 	Ergonomics
	C	Computer System and Interface Architecture
		C1	Input and Output Devices
		C2 	Dialogue Techniques
		C3 	Dialogue Genre
		C4 	Computer Graphics
		C5	Dialogue Architecture
	D	Development Process
		D1 	Design Approaches
		D2	Implementation Techniques
		D3 	Evaluation Techniques
		D4 	Example Systems and Case Studies
	P	Project Presentations and Examinations
(source: Curricula for Human-Computer Interaction (ACM SIG CHI) http://sigchi.org/cdg/index.html
(source: Curricula for Human-Computer Interaction (ACM SIG CHI) http://sigchi.org/cdg/index.html
Interface design theories and principles
In general, user interface design involves interdisciplinary research, including computer science, experimental psychology, graphic design, and software engineering (Shneiderman, 1998). From a cognitive perspective, Foley and van Dam proposed a comprehensive framework of four level approaches of human computer interactions:
(Foley, et al. 1990)
Another high-level theory of human computer interactions is the GOMS (goals, operators, methods, and selection rules model), which focuses on the analysis of estimating task times and identifying task steps (Card, et al. 1983). These high-level models provide a conceptual way to understand the interaction mechanisms between users and systems. Besides these cognitive models, HCI research also attempts to provide a systematic methodology, including many different design principles and guidelines. The early guidelines of user interface design from Hansen (1971) are:
| Know the user | |
| Minimize memorization | |
| Optimize operations | |
| Engineer for errors |
Several useful principles and perspectives are listed by Foley and Wallace (1974), Gaines and Shaw (1984) , and Rubinstein and Hersh (1984), which provide a comprehensive perspective on the user interface design and human computer interactions. More recent principles can also be found in Heckel (1991) and Shneiderman (1998). In addition to these general design principles, Gould and Lewis (1985) proposed an elegant formulation of user interface design based on an operational perspective, which can be embedded in an actual design process:
| Early Focus on Users; | |
| Integrated Design; | |
| Early---and Continual---User Testing; | |
| Iterative Design. |
(Gould and Lewis, 1985; Gould, 1988; Gould, Boies, and Lewis, 1991).
A step further, "TASK-CENTERED USER INTERFACE DESIGN---A Practical Introduction" (http://hcibib.org/tcuid/ ) by Lewis and Rieman (1993) provides an eleven step design process, which is structured around specific tasks that the users want to use to accomplish. The eleven-step process gives a concrete way to transfer the principles into practical design procedures:
In doing the actual design process, interface designers need to consider broader aspects of user interface, including high-level theories and principles, actual design work plans, software tools, prototyping, and evaluation methods. Shneiderman (1998) suggested that a successful design of user interfaces will depend on the following three pillars:
| Guidelines documents and processes: provide a clear set of principles for developers to follow and ensure a harmony in design across products. | |
| User Interface Software tools: are used for prototyping and the implementation of actual design. | |
| Expert reviews and usability testing: ensure a successful product for users. |
(Shneiderman, 1998)
Although there are quite different HCI theories and interface design principles as mentioned above, the essential idea among these theories and principles is the need for contacts, interactions, and collaborations between software developers and actual users during the whole process of interface design. Task-centered design (or user-centered design) is the key for the success of user interface design (Lewis and Reiman, 1993; Landauer, 1995). A prominent design without concerning users and the nature of their tasks will eventually fail due to the neglect of usability. That is a major problem for current GIS user interfaces. The next sections will focus on the GIS user interface and discuss the problem of GIS usability.
![]()
General Guidelines (Heuristic Analysis) Example:
Nielsen and Molich's Nine Heuristics (1990)
Simple and natural dialog
- Simple means no irrelevant or rarely used information.
Natural means an order that matches the task.
Speak the user's language
- Use words and concepts from the user's world. Don't
use system-specific engineering terms.
Minimize user memory load
- Don't make the user remember things from one action
to the next. Leave information on the screen until
it's not needed.
Be consistent
- Users should be able to learn an action sequence in
one part of the system and apply it again to get
similar results in other places.
Provide feedback
- Let users know what effect their actions have on the
system.
Provide clearly marked exits
- If users get into part of the system that doesn't
interest them, they should always be able to get out
quickly without damaging anything.
Provide shortcuts
- Shortcuts can help experienced users avoid lengthy
dialogs and informational messages that they don't
need.
Good error messages
- Good error messages let the user know what the problem
is and how to correct it.
Prevent errors
- Whenever you write an error message you should also
ask, can this error be avoided?
![]()
User interfaces for Geographic Information Services and their usability
Although the development of GIS has been over three decades, the research of GIS user interface was not recognized as an important topic until a decade ago (Gould, 1989; Mark, 1989; Frank and Mark, 1991). The early development of GIS software is mainly inherited from the CAD and database software, which are usually command-lines or menu-driven interfaces. Since more and more research projects on GIS user interface (Mark and Frank, 1992; Medyckyj-Scott and Hearnshaw, 1993; Nyerges et. al, 1995) indicate that the neglect of GIS user interface design in the early stage undermines the usability of GIS and the productivity of GIS, the GIS community start to realize the importance of user interface design. Current GIS software and interface research focus on the adoption of Graphic User Interface (GUI). Many research and case studies indicate that GUI users are more satisfied compared to the users of command-based interface (Marcus, 1990; Graham, 1994). Many GIS vendors were developing GUI to improve the competitiveness of their GIS software such as ESRI’s ArcView, ERDAS’s IMAGINE, and INTEGRAPH’s Microstation and MGE. Some academic research projects also focus on the design of an intuitive and friendly user interface for spatial data analysis and operations, such as graphic map algebra (Tomlin, 1990; Kirby and Pazner, 1990; Egenhofer, 1997) and direct manipulation (Gould, 1993; Tsou and Buttenfield, 1996).
However, "The design of GUI is generally inappropriate for GIS purpose, especially spatial task definition; the language specification for interaction with spatial database using spatial operations and queries are too complex and system specific. It is suggested that the design of next generation user interfaces must be rooted in the creation of a user environment which integrates the data modeling process, the availability of spatial operations and queries, and the system of assistance and concept support within the interface." (Gould, 1993, p. 102)
Since the applications and operations of GIS have become more complicated and diversified, GIS users usually have difficulty in handling GIS along with poorly-designed interfaces, such as command-lines or macro languages. Even the adoption of GUI may not be appropriate to conquer the complicated features of GIS operations. To design an effective and friendly user interface will be a crucial element for the next generation Geographical Information Systems.
The inappropriate design of GIS user interfaces causes the problem of usability, GIS users have been complaining about "unfriendly" GIS user interfaces for a long time. Recent research and user surveys indicate the existing usability problems of GIS user interface as the following (Davies and Medyckyj-Scott, 1994, 1996):
(Davies and Medyckyj-Scott, 1994, 1996)
In a nutshell, the problems of GIS usability are the lack of an appropriate user interface mechanism to conquer the complicated features of GIS operations and modeling, and the lack of involvement and participation of GIS users during the software development process. Thus, in order to improve the usability of GIS, the design of GIS software should focus on the user-centered design process and the development of an appropriate user interface mechanism. The next sections will introduce several interface mechanisms, which need to be considered in the design of GIS user interfaces.
Interface mechanisms
The early development of interface mechanisms includes commands-lines, menu-driven, and form-fills, which are all text-based user interfaces. In 1981, Xerox introduced the 8010 "Star" information system (Johnson at el., 1989), which became the first system adopting Graphic User Interfaces (GUI). Basically, GUI, including windows, icons, menus, and pointing devices (WIMP) adopt a mouse-driven mechanism. Following the Star system, Apple's Macintosh, UNIX's X-windows, and Microsoft's Windows are all based on the GUI design principles. Today, GUI have become the most popular user interface mechanism.
A. Direct Manipulation Interface
Along with the success of GUI, the concept of direct manipulation arises and is well discussed in the HCI community. In general terms, direct manipulation is "a representation of reality that can be manipulated" (Nelson, 1980). "The user is able to apply intellect directly to the task; the tool itself seems to disappear" (Rutkowski, 1982) and "feeling of involvement directly with a word of objects rather than communicating with an intermediary" (Hutchins et al., 1986). Shneiderman (1997) suggests three principles in the design of direct manipulation user interfaces:
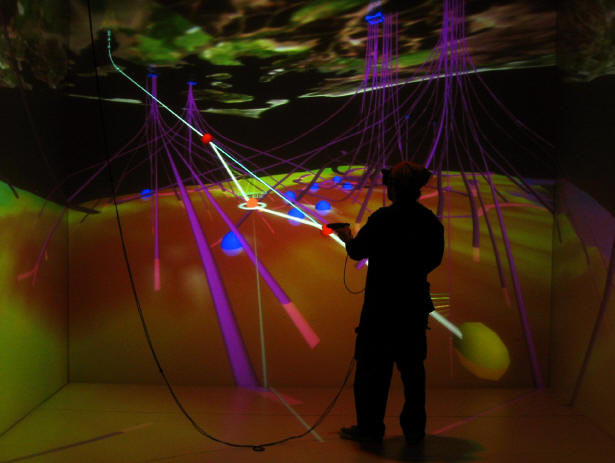
Immersive Visualization ( http://www.bpvizcenter.com/index.php ) (The BP Center for Visualization at Boulder, Colorado).
(BUS demos)
B. Intelligent Agent
Contrary to the basic idea of direct manipulation, intelligent agents have also been a significant new direction in human-computer interface design (Moor et al., 1997). Mae (1994) defines an agent as a personal assistant who is collaborating with the user. Kay (1984) suggests that agents should be illusions that mirror the user's intelligence while restricting the user's agenda. More and more research projects (Rich and Sidner, 1997; Thomas and Fischer, 1997; Knapik and Johnson, 1998) suggest that intelligent agents will be widely used and implemented in the future, especially in open, distributed systems, where intelligent agents can provide services in data filtering, information searching, on-line tutoring, and so on. Norman (1994) lists several design principles for creating agents as the following:
In summary, the differences between direct manipulation interfaces and intelligent agent-based interfaces relates to the level or degree of user control (Shneiderman, 1993), which is similar to the comparison of standard transmission cars and automatic transmission cars. In practice, the level of control should depend highly on the level of user skills, preferences and tasks. The user control problem also comes with the use of "visible" versus "invisible" agents. Currently, design of most intelligent agents is visible, which means that the agent makes its presence known through dialog with the user. It is expected that some users feel that agent interruptions are intrusive. Invisible agents may solve this problem but introduce another, which is that users will be unable to monitor and control agent behaviors. These issues can only be resolved through subject testing in free and structured interface use (Buttenfield and Larson, 1996). In order to develop an appropriate user interface mechanism for GIS operations and analysis, the balance of direct manipulation and intelligent agents will be the key for the success of next generation GIS user interfaces.

Related Links:
| Human-Computer Interaction Resources on the Net http://www.ida.liu.se/labs/aslab/groups/um/hci/ | |
| HCI index http://duticai.twi.tudelft.nl/hci/ | |
| Task-Centered User Interface Design, Clayton Lewis & John Rieman. This book is Shareware (via FTP site) | |
| ACM SIGCHI Special Interest Group on Computer-Human Interaction http://www.acm.org/sigchi/ | |
| A Brief History of Human Computer Interaction Technology http://www.cs.cmu.edu/~amulet/papers/uihistory.tr.html | |
| Carnegie Mellon University's Human-Computer Interaction Institute (HCII) http://www.cs.cmu.edu/afs/cs.cmu.edu/usr/hcii/www/Overview/Overview.html | |
|
Human Computer Interaction Notes: Advanced Graphics & HCI Dr Alan Blackwell University of Cambridge Computer Laboratory Part II course 1999-2000 http://www.cl.cam.ac.uk/Teaching/1999/AGraphHCI/HCI/ |
ISO standard 13407: Human
Centered Design for Interactive Systems
The ISO 13407 standard includes five steps for the
implementation of UCD applications:
(1) prepare and plan for human-centered work processes,
(2) understand and specify the context of use,
(3) specify the user and organizational requirements,
(4) produce design solutions, and
(5) evaluate designs against requirements.
One important aspect of the ISO 13407 standard is iterative looping through these steps (Figure 3-4). Results from the fifth step can be applied to the product from the second step in an iterative loop of user feedback and revision (ISO, 1999) that continues until the objectives and user needs are satisfied.
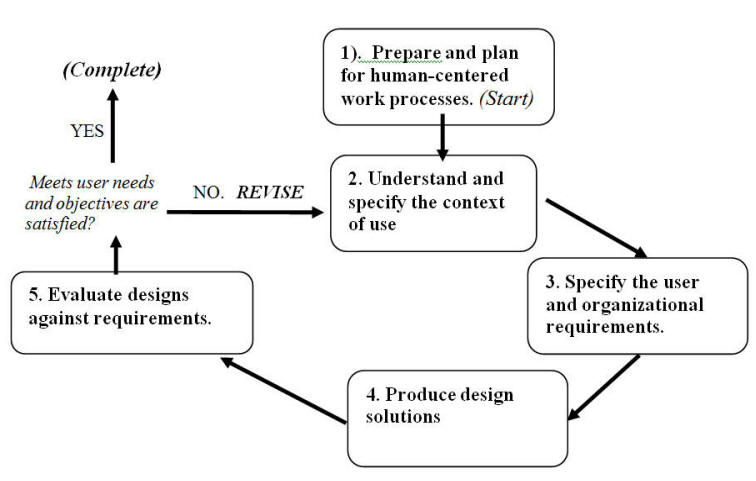
The
ISO 13407 Human centered design processes for interactive systems.
(Modified from the ISO 13407 Model Overview).
![]()
Unit SEVEN (Session Two):
![]()
On-line Forum Discussion
Blackboard URL: https://blackboard.sdsu.edu/
![]()
A Five-Stage User Centered Design
Framework for Web-based Mapping Applications
The following paragraphs will introduce a conceptual design
framework for the three web mapping components adopted from UCD approaches.
This example originated from the book,
The Elements
of User Experiences: User-centered Design for the Web, by
Jesse James Garrett (Garrett, 2002).
In the book, Garrett describes five progressive levels of
website design and implementation procedures.
All website design and implementation should consider the following five
stages:
·
Stage 1: Strategy plane: What do we
want to get out of the site? What do our users want?
·
Stage 2: Scope plane: Transformation
of strategy into requirements: What
features will the site need to include?
·
Stage 3: Structure plane: Giving
shape to scope: How will the pieces of the site fit together and integrate?
·
Stage 4. Skeleton plane: Making
structure concrete: What components will enable people to use the site?
·
Stage 5: Surface plane: Bringing
everything together visually: What will the finished product look like?
(Garretts,
2002, URL: http://jjg.net/elements/,
accessed on
Garrett’s five-stage framework is similar to the ISO standard
13407, “Human Centered Design for Interactive Systems”.
However, Garrett’s framework is more specific to the design of web
applications rather than general software packages.
It also emphasizes the two major components of websites: content design
(information architecture) and user interface design.
Moreover, the ISO 13407 standard places emphasis on the progressive
nature of the framework. That is,
each development stage must be completed sequentially.
Garrett’s work indicates that each development stage can be overlapping
if necessary. For example, the
development of the structure stage can start before the completion of the scope
specification stage. If there are
major changes in the design structure, those changes can be re-examined
immediately on the previous scope stage and appropriate modifications can be
implemented. This research utilizes
Garrett’s five-stage approach for the design of web-based mapping applications
with user interfaces, map contents, and map display characteristics.
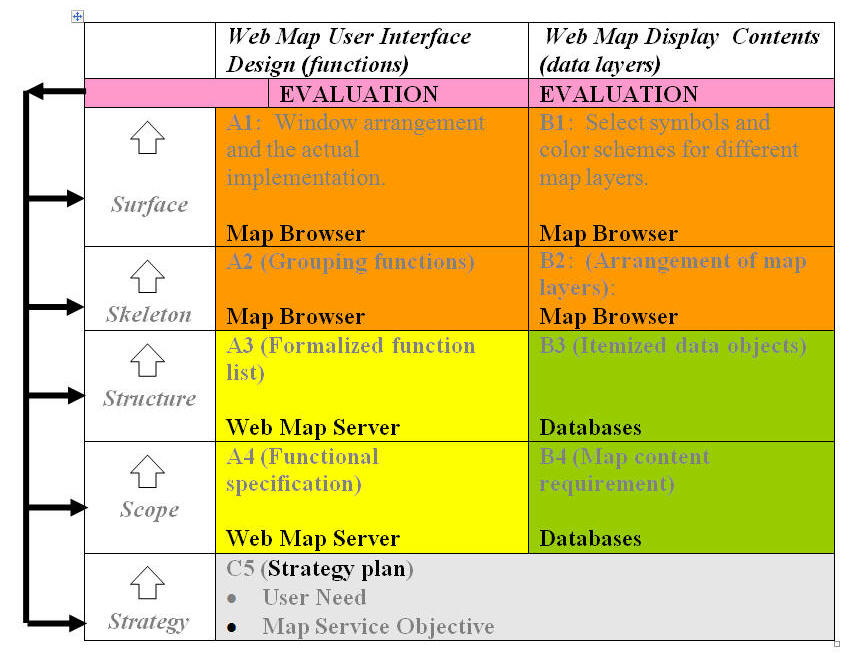
Figure 3 illustrates five different design levels that consider the dual
aspects of web mapping: the user interface design and the map contents/display.
|
|
Web Map User Interface Design
(functions) |
Web
Map Display Layers
(data contents) |
|
Surface |
A1:
Window arrangement and the actual use of graphic icons, buttons,
windows, and hyperlink for the user interface.
|
B1:
Select symbols and color schemes for different map layers.
|
|
|
A2 (Grouping functions)
·
Map
Display Window
o
Zoom-in
o
Zoom-out
o
Pan
·
Tool Box
Window
o
Query
o
Identify
o
Show
attributes |
B2:
(Arrangement of map
layers):
·
Base
layers:
o
Roads
o
Highways
·
Hydro-layers:
o
2006
monitoring sites
o
2005
monitoring sites |
|
|
A3 (Formalized function list)
·
Map
Display functions
·
Spatial
identify functions
·
Query
functions
·
Data
download functions
·
Help
functions and on-line tutorials |
B3 (Itemized data objects)
·
Streams (shapefiles)
·
Watershed
boundaries (ArcSDE)
·
Water
gage sites (shapefiles)
·
Roads (shapefiles)
·
Metadata
(text files) |
|
|
A4 (Functional specification)
·
Interactive map manipulation (Zoom-in, Zoom-out, to interested areas).
·
Query
water quality at monitoring sites within specific watersheds.
·
Download
GIS data if needed.
·
Help and
online assistant tools. |
B4 (Map content requirement)
·
Display
hydrological maps.
·
Identify
real-time water gages and create links to the gage data.
·
Descriptions of these maps and data. |
|
Strategy |
C5 (Strategy plan)
·
User Need
Example: Hydrologists need to gather and query hydrological data and
information for the management of watersheds.
Web-based mapping is the best solution because web-based maps are
more accessible and easy to use compared to traditional GIS. Users do
not need to install GIS locally.
·
Map Service Objective
Example: This mapping
service can help hydrologists manage watersheds more effectively. |
|
Figure 3.
The five stages of user-centered design approaches for web mapping
applications.
From a
developer’s perspective, there are two major design tasks of web mapping
applications: functionality and map contents.
This research proposes a design framework through five development stages
(based on Garret’s framework) for the major components of web mapping services:
web map user interface (functions) and web map display layers (data contents)
(Figure 3).
The
initial stage of web map application design is the Strategy stage.
This first stage should focus on the definition of user needs and the
objectives of mapping services. Figure
2 uses a hypothetical situation to illustrate the beginning of the design
processes for web mapping services.
In this example, a federal agency creates a mapping service designed for
hydrologists to easily access watershed information to facilitate decision
making. The objective of mapping
services in this example is to help hydrologists manage watersheds more
effectively. The user need is
defined as the need for accessible web-based information and tools for
hydrologists.
The
second stage, the Scope stage, focuses on the identification of the web mapping
service scope. There are two
aspects of the Scope stage: functional specification and map content
requirements. The functional
specification involves identification of the major tasks as determined by user
needs and map objectives. In the
example presented, the major tasks include interactive map manipulation,
querying attributes from water quality monitoring sites, and downloading GIS
data. The map content requirement
includes the display of hydrological maps, access to real-time water monitoring
sites, and integration of map hyperlinks to the real-time hydrologic data.
The website also needs to provide
ancillary information about these maps (metadata).
In the
third stage, the Structure stage, design issues focus on the formalization of
mapping functionality and the itemization of map data contents. For the user
interface, this stage focuses on creating a comprehensive list of mapping
functions such as map display, spatial query, buffering, data download, and help
functions. Each function should be
intuitive and unique to fulfill the functional requirements indicated in the
Scope stage. In the design of
data content, a focus on itemizing data objects and creating a complete data
list based on stage two (content requirements) findings is emphasized.
For example, to display hydrological maps, the list of data objects
should include streams, water gage sites, roads, watershed boundaries, etc.
The
fourth design stage is the Skeleton stage.
In the Skeleton stage, the focus shifts to the arrangement of data
objects into a meaningful category and the grouping of mapping functions with a
conceptual hierarchy. For
example, the [zoom-in], [zoom-out] and [pan] functions should be grouped
together in the map display window.
In data content design, the data layers should fall into one of two different
categories: hydrologic layers (the main theme) and base layers (supporting
information).
The
Surface stage is the final and most important stage.
In this stage, the actual design of web map user interfaces and the
incorporation of map contents is completed and used directly by map users.
The design of graphic icons, buttons,
and window layout are major functional tasks in this stage.
For map contents, selecting symbols, text fonts, and color schemes for
different map layers is completed in this stage.
References:
Baecker, R. M., Grudin, J., Buxton, W. A. S., & Greenberg, S. (1995). Reading in Human-Computer Interaction: Toward the Year 2000. (Second Edition) San Francisco, California: Morgan Kaufmann Publishers, Inc.
Beard, K. M., Buttenfield, P. B., and Clapham, S. B., 1992, NCGIA Research Initiative 7: Visualization of Spatial Data Quality.
Buttenfield, B. P. and Mackaness, W. A., 1991, Visualization, In: Maguire, D. J., Goodchild, M. F., And Rhind, D. W. edited. Geographical Information Systems: Principle and Application, Longman, London, pp. 427-443.
Buttenfield, P. B., and Weber, C. R., 1993, Visualization and Hypermedia in Geographical Information Systems, In: Medyckyj-Scott, D. and Hearnshaw, H. M. edited. Human Factors in Geographical Information Systems, Belhaven Press, London, pp. 136-147.
Card, S., Moran, T. P., & Newell, A. (1983). The Psychology of Human-Computer Interaction. Hillsdale, New Jersey: Lawrence Erlbaum Associates.
Davies, C. (1995). Tasks and Task Descriptions for GIS. In T. L. Nyerges, D. M. Mark, R. Laurini, & M. J. Egenhofer (editors), Cognitive Aspects of Human-Computer Interaction for Geographic Information Systems. Dordrecht: Kluwer Academic Publishers. pp. 327-342.
Davies, C., & Medyckyj-Scott, D. (1994). GIS usability: recommendation based on the user's view. International Journal of Geographical Information Systems, 8(2), pp. 175-189.
Davies, C., & Medyckyj-Scott, D. (1996). GIS users observed. International Journal of Geographical Information Systems, 10(4), pp. 363-384.
Foley, J. D., van Dam, A., Feiner, S. K., & Hughes, J. F. (1990). Computer Graphics: Principles and Practices (Second Edition), Reading, Massachusetts: Addison-Wesley.
Foley, J., & Wallace, V. (1974). The Art of Natural Graphic Man Machine Conversation. Proceedings of the IEEE. 62(4), pp. 462-471.
Frank, A. U., 1993, Human Factors in Geographical Information Systems, In: Medyckyj-Scott, D. and Hearnshaw, H. M. edited. Human Factors in Geographical Information Systems, Belhaven Press, London, pp. 12-19.
Gaines, B., & Shaw, M. (1984). The Art of Computer Conversation. Englewood Cliffs, New Jersey: Prentice Hall, Inc.
Gould, J. (1988). How to Design Usable Systems. In M. Helander (editor), Handbook of Human-Computer Interaction. North Holland: Elsevier. pp. 757-789.
Gould, J., & Lewis, C. (1985) Designing for Usability---Key Principles and What Designers Think. Communications of the ACM 28(3), pp. 300-311.
Gould, J., Boies, S., and Lewis, C. (1991). Making Usable, Useful, Productivity-Enhancing Computer Applications. Communications of the ACM 34 (1), pp. 74-85.
Gould, M. D. (1989). Human Factors Research and its Value to GIS User Interface Design. In Proceedings of GIS/LIS'89, Orlando, Florida. pp. 542-550.
Gould, M. D. (1993). Chapter 8: Two Views of the User Interface. D. Medyckyj-Scott, & H. M. Hearnshaw (editors), Human Factors in Geographical Information Systems. London: Belhaven Press. pp. 101-110.
Hansen, W. (1971). User Engineering Principles for Interactive Systems. AFIPS Conference Proceedings 39, AFIPS Press, pp. 523-532.
Heckel, P. (1991). The Elements of Friendly Software Design. (The New Edition) San Francisco: Sybex.
Hutchins, E. L., Hollan, J. D., & Norman, D. A. (1986). Direct manipulation interfaces. In D. A. Norman & S.W. Draper (editors),User Centered System Design: New Perspectives on Human-Computer Interaction. Hillsdale, New Jersey: Lawrence Erlbaum Associates, pp. 87-124.
Johnson, J. Roberts,T.L., Verplank. W., Smith, D. C., Irby. C.H., Beard, M., & Mackey, K. (1989). The Xerox Star: A Retrospective. IEEE Computer 22(9), pp. 11-29.
Johnson, M., 1987, The Body in the Mind: The Bodily Basis of Meaning, Imagination and Reason, University of Chicago Press, Chicago.Kay, A. (1984). Computer Software. Scientific American, 251(3), pp. 191-207.
Knapp, L., 1994, GIS vs. SVS, in Rhyne, T. M., Ivey, W., Knapp, L., Kochevar, P., and Mace, T. Panel Papers: Visualization and Geographic Information System Integration: What are the needs and the requirements , if any?, Proceedings Visualization '94, October 17-21, 1994, Washington, D.C., IEEE Computer Society Press. pp. 401-402.
Kuhn, W., Willauer, L., Mark, David M., and Frank, A. U., 1992, User Interfaces for Geographic Information Systems: Discussions at the specialist meeting, Research Initiative 13, Report on the Specialist Meeting: User Interfaces for Geographic Information Systems, pp. 1-35.
Landauer, T. K. (1995). The Trouble with Computers: Usefulness, Usability, and Productivity. Cambridge, Massachusetts: The MIT Press.
Lewis, C., & Rieman, J. (1993). Task-Centered User Interface Design. Published over the Internet: ftp://ftp.cs.colorado.edu.
Maes, P. (1994). Agents that Reduce Work and Information Overload. Communications of the ACM, 37(7), pp.31-40.
Marcus A. (1990). Designing Graphical User Interfaces, UnixWorld August 1990, 7 (8) pp.107-116.
Mark, D. M. (1989). Cognitive Image-Schemata for Geographic Information: relations to user views and GIS interfaces. In Proceedings of GIS/LIS'89, Orlando, Florida, pp. 551-560.
Mark, D. M., (1993), Human Spatial Cognition, In: Medyckyj-Scott, D. and Hearnshaw, H. M. edited. Human Factors in Geographical Information Systems, Belhaven Press, London, pp. 51-60.
Mark, D. M., and Gould, M. D., 1991, Interacting with geographical information: A commentary, Photogrammetric Engineering and Remote Sensing, Vol. 57, No. 11, pp. 1427-1430.
Mark, David M. & Frank, Andrew U., editors. (1992). User Interfaces for Geographic Information Systems: NCGIA Research Initiative 13, Report on the Specialist Meeting (Techical Report No. 92-3). National Center for Geographic Information and Analysis.
Medyckyj-Scott, and Hearnshaw, H. M. edited., 1993, Human Factors in Geographical Information Systems, Belhaven Press, London.
Moore, J., Rdmonds, E., & Puerta, A. (editors) (1997). Proceedings of IUI'97: International Conference on Intelligent User Interfaces, January 6-9, 1997, Orlando, Florida. New York: ACM.
Nelson, T. (1980). Interactive Systems and the Design of Virtuality. Creative Computing November 1980, 6(11), p.56.
Norman, D. (1994). How People Might Interact with Agents. Communications of the ACM, 37(7), pp. 69-71.
Nyerges, T. L., Mark, D. M., Laurini, R., & Egenhofer, M. J., editors. (1995). Cognitive Aspects of Human-Computer Interaction for Geographic Information Systems . Norwell, Massachusetts: Kluwer Academic Publishers.
Rhyne, T. M., Ivey, W., Knapp, L., Kochevar, P., and Mace, T., 1994, Panel Papers: Visualization and Geographic Information System Integration: What are the needs and the requirements , if any?, Proceedings Visualization '94, October 17-21, 1994, Washington, D.C., IEEE Computer Society Press, Los Alamitos, California, pp. 400-403.
Rich, R. & Sidner, C. L. (1997). Segmented Interaction History in a Collaborative Interface Agent, In the Proceedings of IUI'97: International Conference on Intelligent User Interfaces, January 6-9, 1997, Orlando, Florida. New York: ACM, pp.23-30.
Roth, S. F., 1994, Keynote Panelist: A Visualization System on Every Desk -- Keeping it Simple, Proceedings Visualization '94, October 17-21, 1994, Washington, D.C., IEEE Computer Society Press, Los Alamitos, California, p.6.
Rubinstein, R., and Hersh, H. (1984). The Human Factor. Burlington, Massachusetts: Digital Press.
Rutkowski, C. (1982). An Introduction to the Human Applications Standard Computer Interface, Part I: theory and principles, BYTE October 1982, 7(11), pp.291-310.
Shneiderman, B. (1993). Beyond Intelligent Machines: Just Do it!: tools, techniques, and concepts to optimize user interfaces. IEEE Computer, 10(1), pp. 100-103.
Shneiderman, B., 1994, Keynote Panelist: The Future of Graphic User Interfaces , Proceedings Visualization '94, October 17-21, 1994, Washington, D.C., IEEE Computer Society Press, Los Alamitos, California, p.7
Shneiderman, B. (1997). Direct Manipulation for Comprehensible, Predictable, and Controllable User Interface, In the Proceedings of IUI'97: International Conference on Intelligent User Interfaces, January 6-9, 1997, Orlando, Florida. New York: ACM, pp.33-39.
Shneiderman, B. (1998). Designing the User Interface: Strategies for Effective Human-Computer Interaction (Third ed.). Reading, Massachusetts: Addison-Wesley.
Thomas, C. G. & Fischer, G. (1997). Using Agents to Personalize the Web, In the Proceedings of IUI'97: International Conference on Intelligent User Interfaces, January 6-9, 1997, Orlando, Florida. New York: ACM, pp.53-60.
Tsou, M.-H., & Buttenfield, B. P. (1996). A Direct Manipulation Interface for Geographical Information Processing. In Proceedings of the 7th International Symposium on Spatial Data Handling, Delft, The Netherlands. IGU. pp. 13B.37-13B.47.
Verplank, W. L., 1988, Graphic Challenges in Designing Object-Oriented User Interface, in Helander, M. edited. Handbook of Human-Computer Interaction, North Holland: Elsevier Science Publishers B. V., ch. 17.
Ziegler, J. E. and Fahnrich, K-P., 1988. Direct Manipulation, in Helander, M. edited. Handbook of Human-Computer Interaction, North Holland: Elsevier Science Publishers B. V., ch. 6.
![]()
![]()
![]()
![]()
![]()
