GEO 583 Internet Mapping and Distributed GIServices
![]()
![]()
![]()
![]()
Unit 11 (Session One):
User Profiles and Web Site Evaluation
![]()
Group 1: The SD Camping Guide
Team members: Jesus A. Tamayo, Caleb Bombaci, Richard Caslow.
Group 2: Pups Who Brunch - San Diego
Team member: Melanie Lopez (Coordinator), Haihong Huang, Fali Field
May 3 (Thursday) from 9:30am - 11:00am. (Required for everyone - signup sheet).
Each Group has 17 minutes presentation (including Video presentation), 3 minutes Q&A
![]()
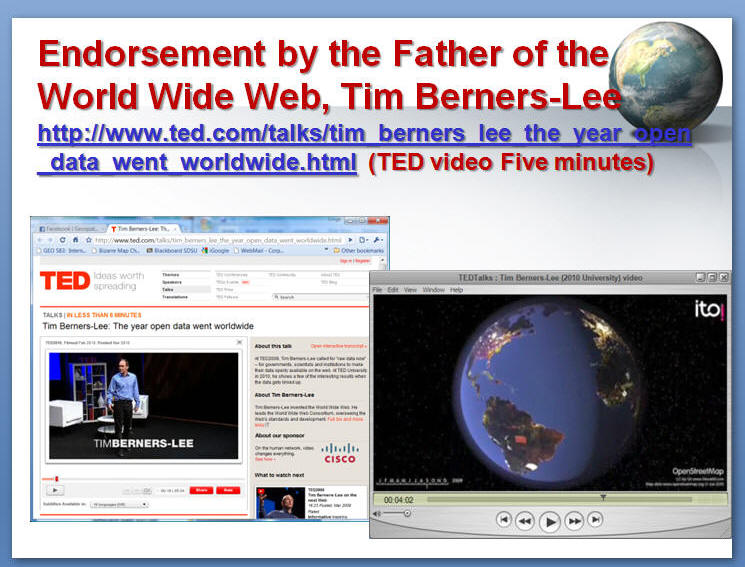
Tim Berners-Lee
http://www.ted.com/talks/tim_berners_lee_the_year_open_data_went_worldwide.html
(TED video Five minutes)
![]()
User Profiles: age, gender, education, occupation, incomes, etc. | |
User Behaviors: Web access time, access methods (Modem, DSL, Cable Modem..) shopping behaviors, etc. | |
| User Tasks: map browsing, searching, entertainment, homework, etc. |
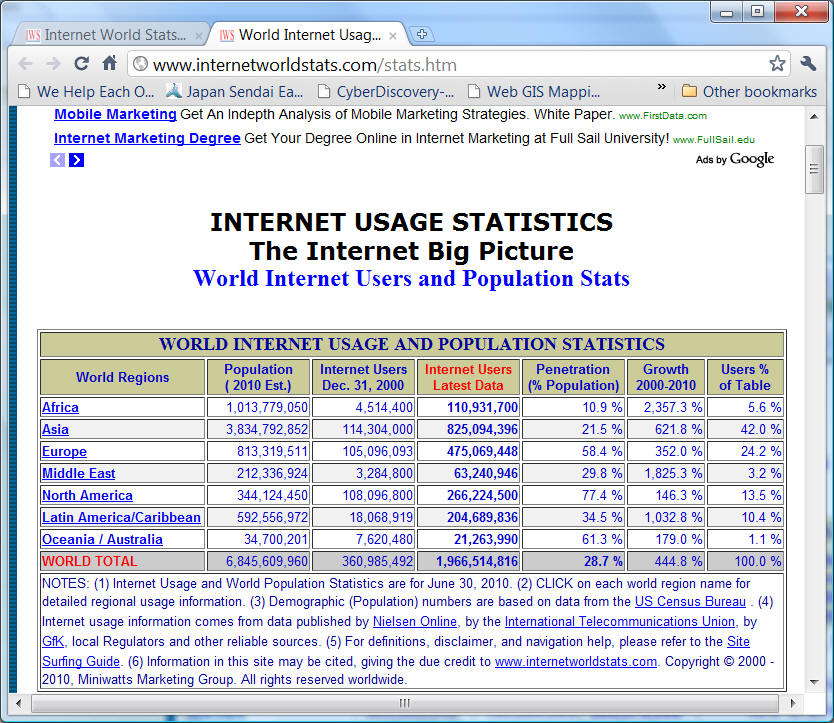
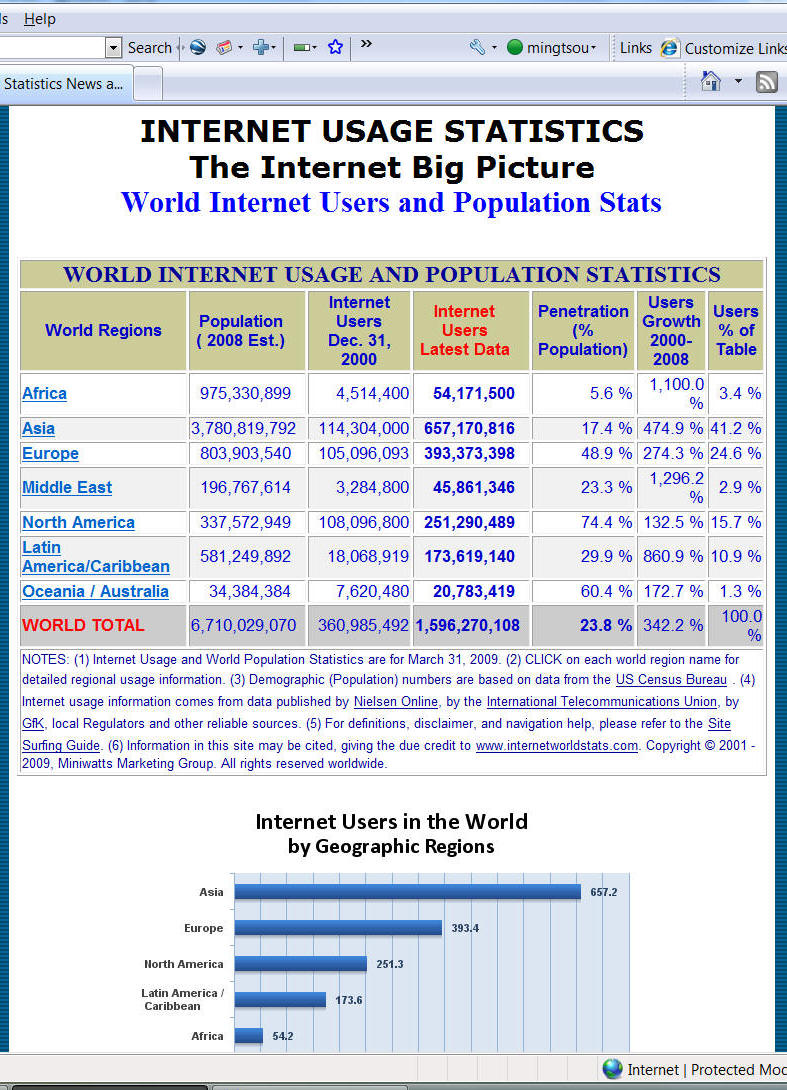
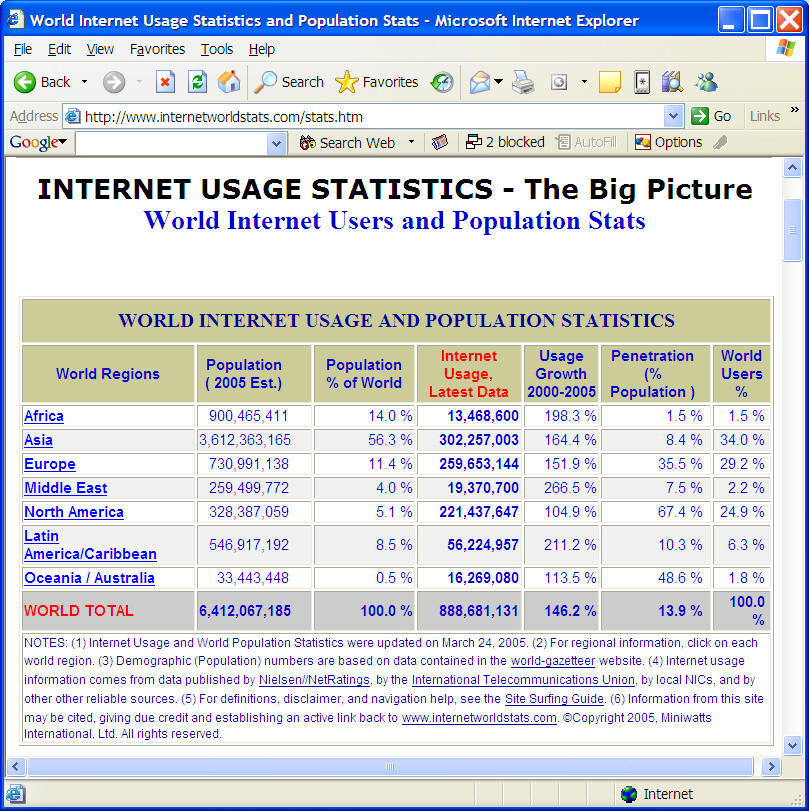
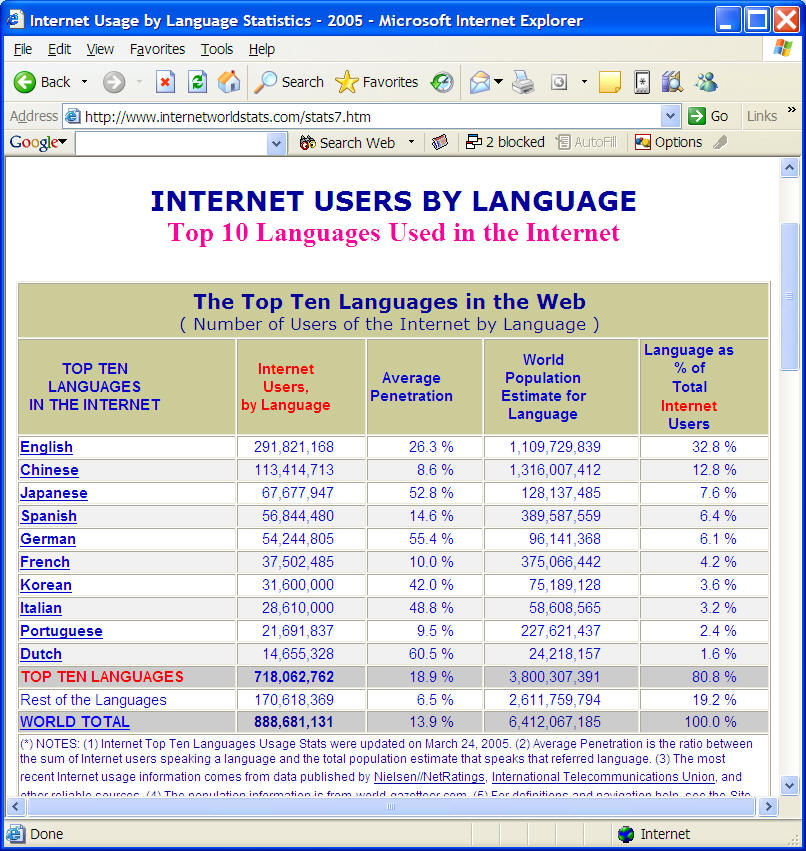
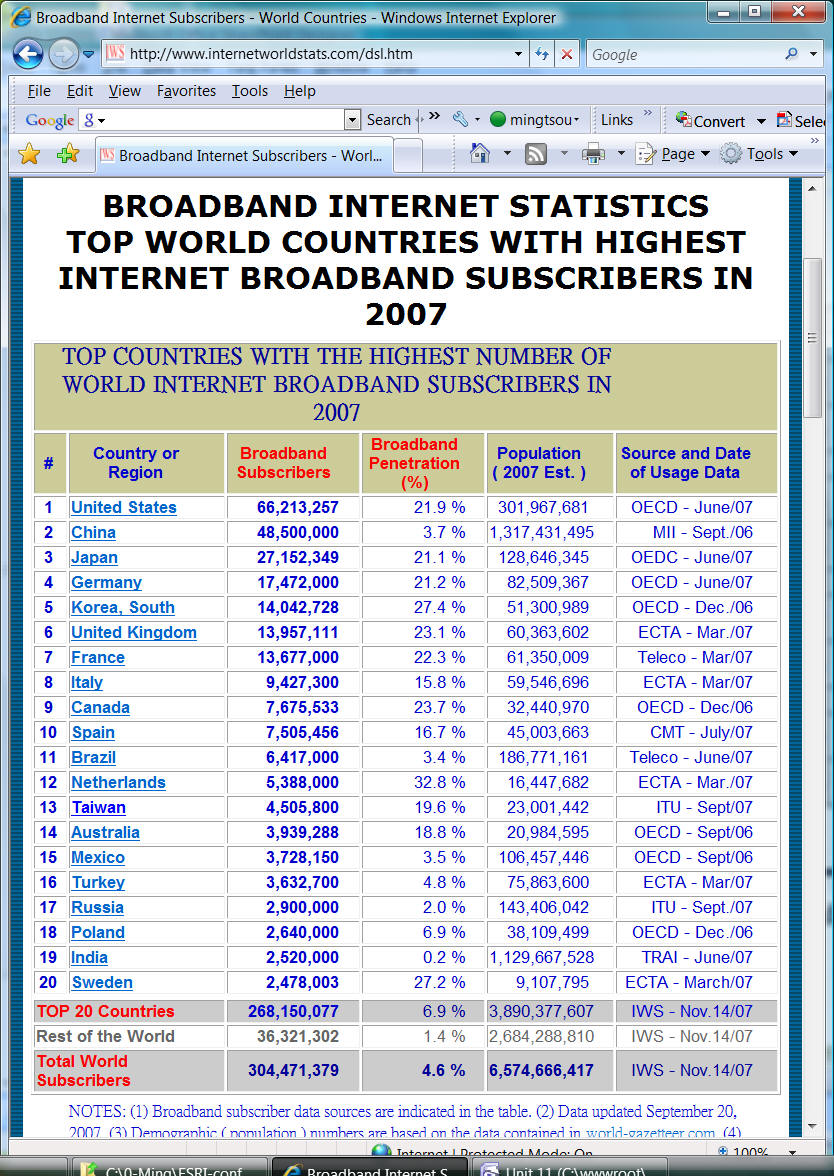
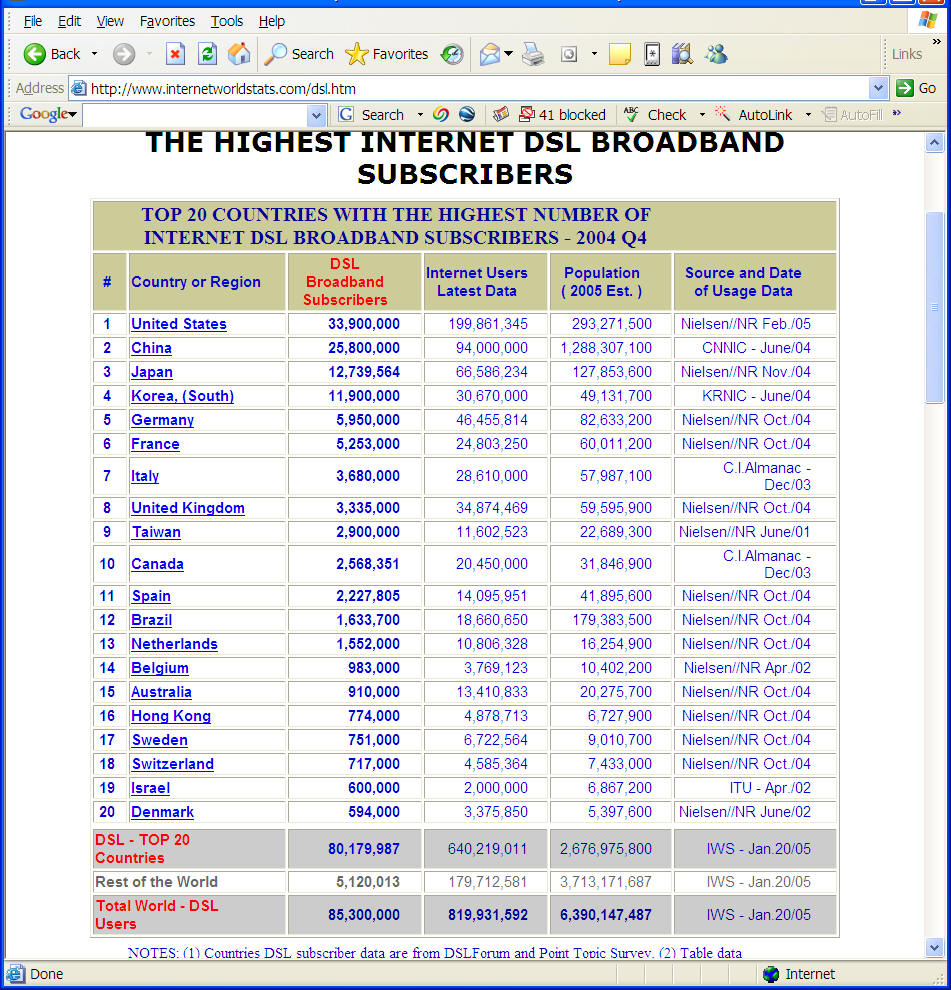
Internet World Stats: http://www.internetworldstats.com
2011
March 31, 2009
2006
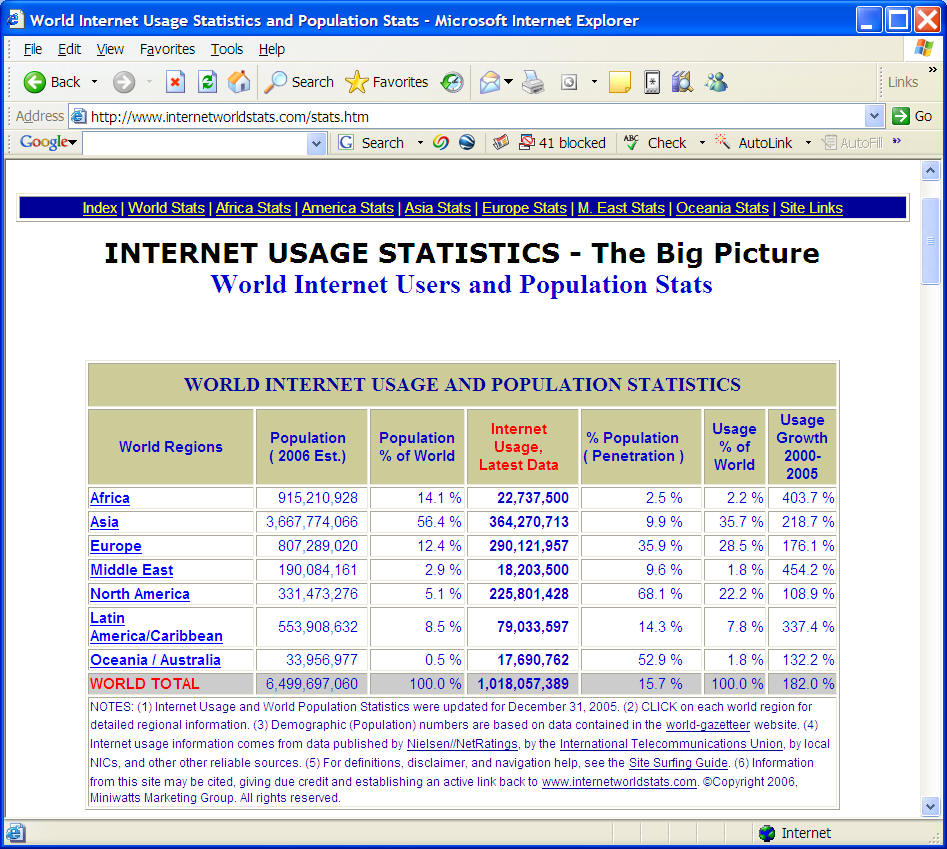
2005
![]()
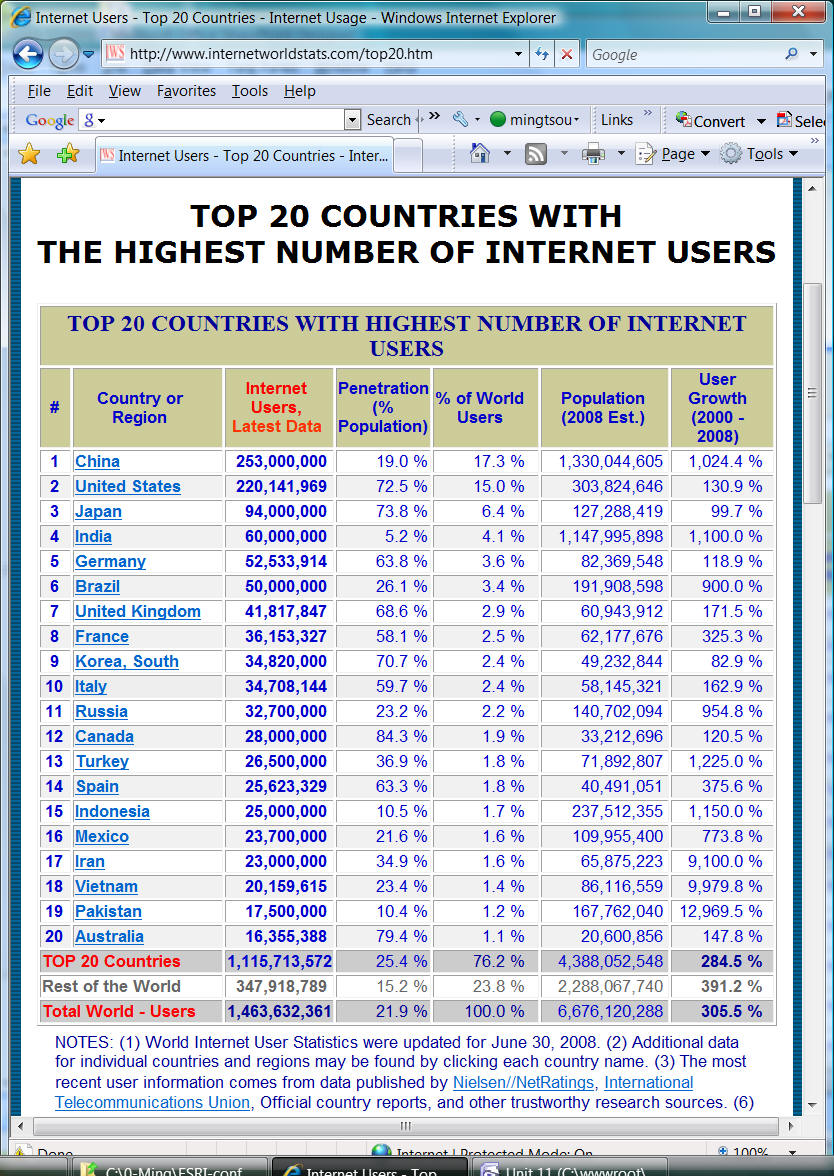
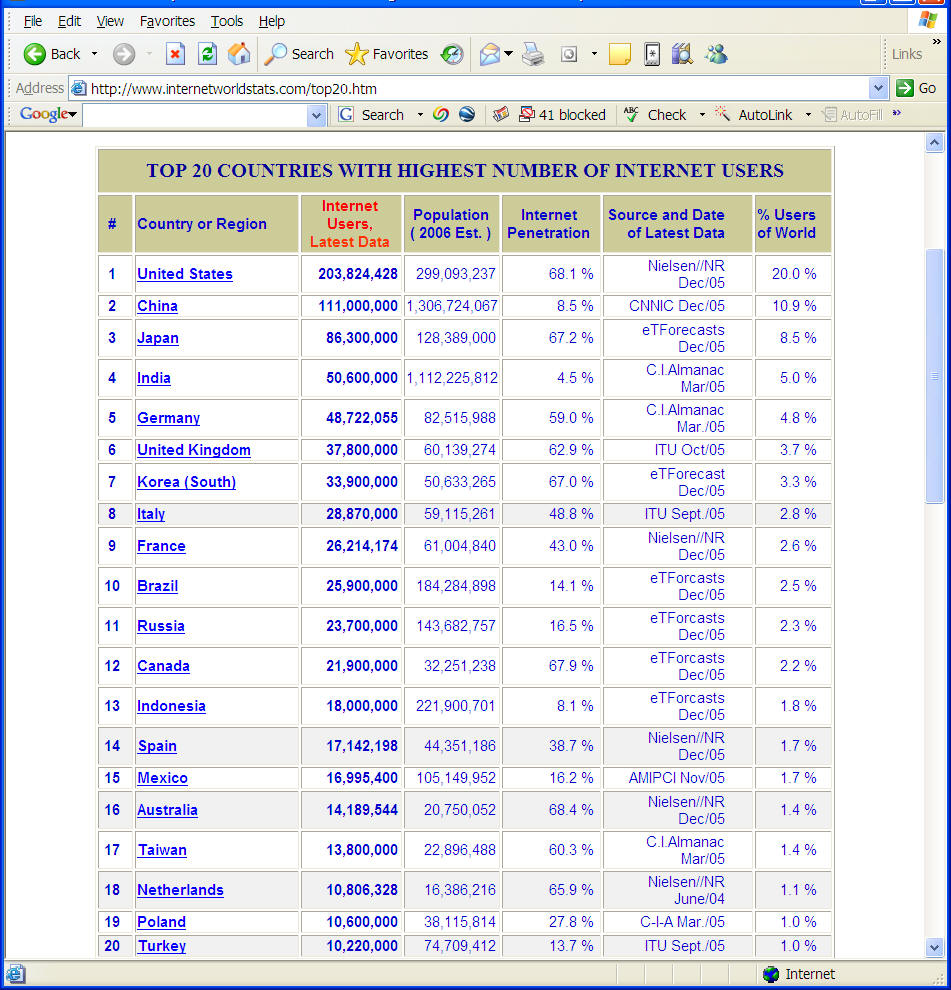
TOP
20 COUNTRIES WITH
THE HIGHEST NUMBER OF INTERNET USERS
http://www.internetworldstats.com/top20.htm
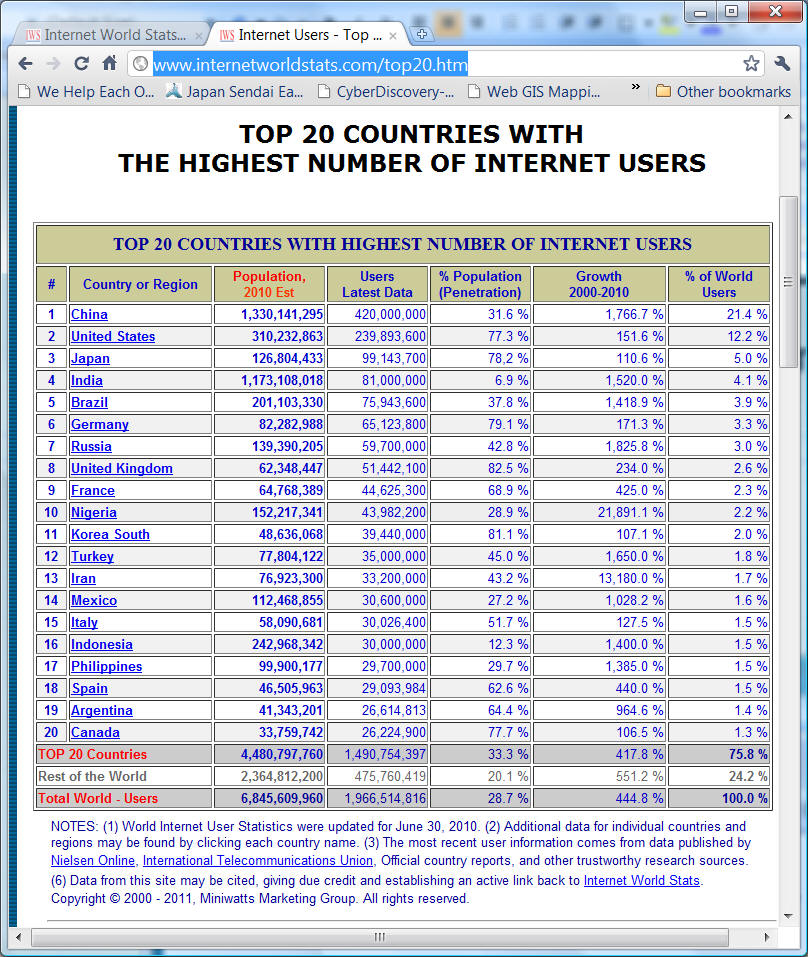
June 30, 2008
In 2006
|
TOP
20 COUNTRIES WITH |
|
||||||||||||||||||||||||||||||||||||||||||||||||||||||||||||||||||||||||||||||||||||||||||||||||||||||||||||||||||||||||||||||||||||||||||||||||||||||||||||||||||||||||||||||||
|
||||||||||||||||||||||||||||||||||||||||||||||||||||||||||||||||||||||||||||||||||||||||||||||||||||||||||||||||||||||||||||||||||||||||||||||||||||||||||||||||||||||||||||||||
| Rank | Country | Weekly Internet Users (#M) | All Internet Users (#M) |
| 1 | U.S. | 114.4 | 134.6 |
| 2 | Japan | 25.4 | 33.9 |
| 3 | Germany | 14.9 | 19.9 |
| 4 | Canada | 13.1 | 15.4 |
| 5 | U.K. | 12.6 | 16.8 |
| 6 | South Korea | 12.4 | 19.0 |
| 7 | China | 11.3 | 22.5 |
| 8 | Italy | 9.3 | 12.5 |
| 9 | France | 6.3 | 9.0 |
| 10 | Australia | 5.3 | 7.6 |
| 11 | Taiwan | 4.5 | 7.0 |
| 12 | Netherlands | 4.1 | 5.5 |
| 13 | Sweden | 3.8 | 4.4 |
| 14 | Spain | 3.6 | 5.6 |
| 15 | Russia | 3.0 | 7.5 |
| -- | Top 15 Countries | 244.0 | 321.2 |
| -- | West Europe | 54.6 | 73.7 |
| -- | Worldwide | 299.6 | 413.7 |
Source: http://www.c-i-a.com/ by Computer Industry Almanac Inc. This study estimates the number of Internet users in 50 countries from 1990 to 2000.
Source: www.internetworldstates.com
(2008)

Today? http://www.internetworldstats.com/stats7.htm
Broadband (High Speed) Internet Usage.
Today?
2004
Wireless Internet Users (predicted in 2001)
|
Year-End
|
2001
|
2004
|
2007
|
| USA | |||
| Internet Users (millions) |
149
|
193
|
236
|
| Wireless Internet User Share |
4.5%
|
27.9%
|
46.3%
|
| Worldwide |
|
|
|
| Internet Users (millions) |
533
|
945
|
1,460
|
| Wireless Internet User Share |
16.0%
|
41.5%
|
56.8%
|
| Asia-Pacific |
|
|
|
| Internet Users (millions) |
115
|
357
|
612
|
| Wireless Internet User Share |
34.8%
|
50.9%
|
60.4%
|
| W. Europe |
|
|
|
| Internet Users (millions) |
126
|
208
|
290
|
| Wireless Internet User Share |
13.9%
|
49.6%
|
67.0%
|
Source: http://www.c-i-a.com/
![]()
Reports from National Telecommunications and Information Administration
2004: A Nation Online: Entering the Broadband Age, http://www.ntia.doc.gov/reports/anol/index.html
2002: A NATION ONLINE: How Americans Are Expanding Their
Use of the Internet.
http://www.ntia.doc.gov/ntiahome/dn/index.html
1999 Report: NTIA: Falling Through the Net, Toward Digital Inclusion. http://www.ntia.doc.gov/ntiahome/fttn99/contents.html
1998: Falling Through the Net II: New Data on the Digital Divide http://www.ntia.doc.gov/ntiahome/net2/
![]()
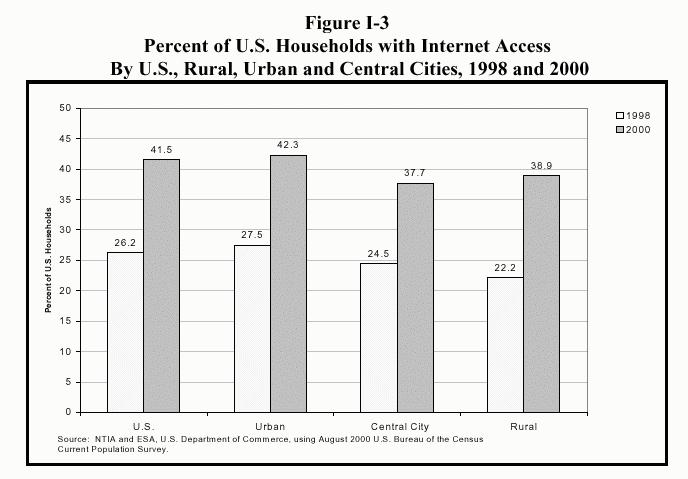
1999 Report: NTIA: Falling Through the Net, Toward Digital Inclusion. http://www.ntia.doc.gov/ntiahome/fttn99/contents.html
This report measures the extent of digital inclusion by looking at households and individuals that have a computer and an Internet connection. Executive Summary in html format
(National Telecommunications and Information Administration, U.S. Department of Commerce)
URL: http://www.ntia.doc.gov/ntiahome/digitaldivide/
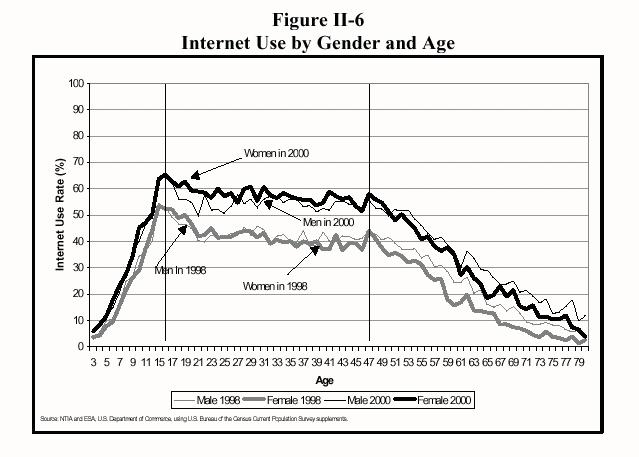
| The gap between households in rural areas and households nationwide that access the Internet has narrowed from 4.0 percentage points in 1998 to 2.6 percentage points in 2000. Rural households are much closer to the nationwide Internet penetration rate of 41.5%. In rural areas this year, 38.9% of the households had Internet access, a 75% increase from 22.2% in December 1998. |
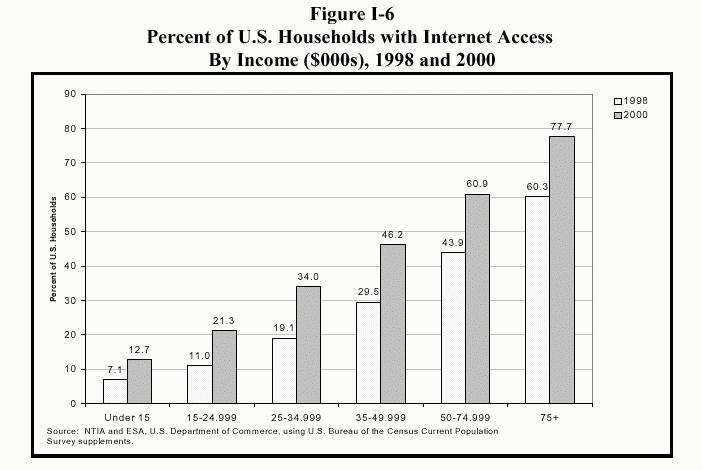
| Americans at every income level are connecting at far higher rates from their homes, particularly at the middle income levels. Internet access among households earning $35,000 to $49,000 rose from 29.0% in December 1998 to 46.1% in August 2000. Today, more than two-thirds of all households earning more than $50,000 have Internet connections (60.9% for households earning $50,000 to $74,999 and 77.7% for households earning above $75,000). |
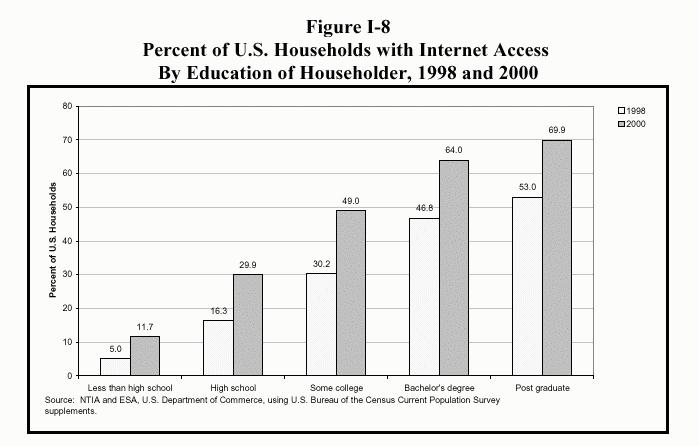
| Access to the Internet is also expanding across every education level,
particularly for those with some high school or college education.
Households headed by someone with "some college experience" showed
the greatest expansion in Internet penetration of all education levels,
rising from 30.2% in December 1998 to 49.0% in August 2000. |
Source: NTIA: Falling Through the Net, Toward Digital Inclusion http://www.ntia.doc.gov/ntiahome/digitaldivide/
Source: NTIA: Falling Through the Net, Toward Digital Inclusion http://www.ntia.doc.gov/ntiahome/digitaldivide/
Source: NTIA: Falling Through the Net, Toward Digital Inclusion http://www.ntia.doc.gov/ntiahome/digitaldivide/
Source: NTIA: Falling Through the Net, Toward Digital Inclusion http://www.ntia.doc.gov/ntiahome/digitaldivide/
Source: NTIA: Falling Through the Net, Toward Digital Inclusion http://www.ntia.doc.gov/ntiahome/digitaldivide/
Source: NTIA: Falling Through the Net, Toward Digital Inclusion http://www.ntia.doc.gov/ntiahome/digitaldivide/
![]()
2004: A Nation Online: Entering the Broadband Age, http://www.ntia.doc.gov/reports/anol/index.html
Figure 1: Percent of Households with Computers and
Internet Connections,
Selected Years, 1997-2003*

*Note: 2001 and 2003 reflect 2000 Census-based weights and earlier years use 1990 Census-based weights.
Table 1: Home Internet Connections by Technology,
2001 and 2003
(Millions of Households)
|
|
2001 |
2003 |
|
Percent Change |
|
Dial-Up |
44.2 |
38.6 |
|
-12.7% |
|
DSL |
3.3 |
9.3 |
|
181.8% |
|
Cable |
6.6 |
12.6 |
|
90.9% |
|
Other* |
0.5 |
0.9 |
|
80.0% |
|
|
|
|
|
|
|
Number of Households with Internet |
54.6 |
61.5 |
|
12.6% |
|
Total Number of Households |
108.6 |
112.6 |
|
3.7% |
|
* “Other” includes 0.4 million households with satellite and MMDS broadband in 2003. The 2003 individual home connection numbers do not add up to the category total due to rounding. |
||||
Figure 4: Individual Internet Use
by Type of Home Internet Connection,
2003 (Ages 3 and Over)
Table 2: Frequency of Persons’ Internet Use by
Home Internet Connection Technology, 2003
(Percentage of Use)
|
|
Uses the Internet at least once a day |
Uses the Internet at least once a week but not every day |
Uses the Internet at least once a month but not every week |
Uses the Internet less than once a month |
Total |
No Internet Access at Home |
38.2 |
36.6 |
13.5 |
11.7 |
100.0 |
|
Dial-up Internet Access at Home |
51.2 |
36.3 |
8.0 |
4.5 |
100.0 |
|
Broadband Internet Access at Home |
66.1 |
26.7 |
4.7 |
2.6 |
100.0 |
Figure 5: Online Activities, 2001 and 2003
(Percent of Internet Users 15 and Over)
Figure 6: Online Activities by Type of Home
Internet Connection, 2003
(Percent of Internet Users 15 and Over)
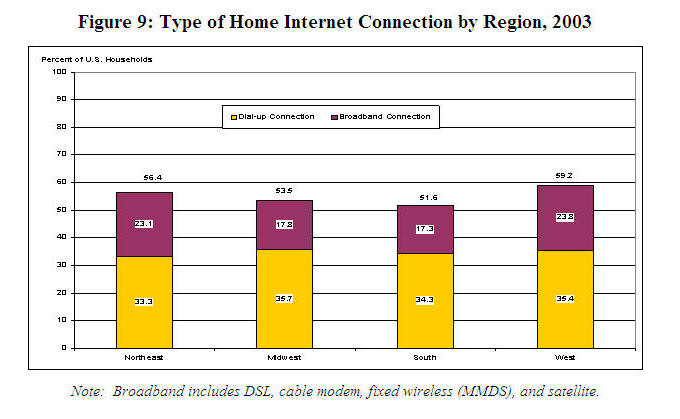
Figure 9: Type of Home Internet Connection by Region, 2003
Note: Broadband includes DSL, cable modem, fixed wireless (MMDS), and satellite.
The proportion of Internet users in the population grew in every state between 2001 and 2003, although the levels and rates of change have not been uniform. As shown in Figure 8, the number of states where less than half of the population uses the Internet declined from four to one, while the number of states where over 70 percent of the population uses the Internet grew from one to six.
Figure 8: Distribution of Internet Use Across the States, 2001
and 2003
(Internet Use by State Population,
Ages 3 and Over)[6]
In general, home broadband adoption rates vary in ways similar to overall Internet adoption rates, although there are some important geographic differences. As shown in Figure 9, rates of dial-up usage are roughly the same across geographic regions. However, broadband rates are higher in the West and Northeast than in the South and Midwest.
![]()
Web Map Users: ???
(MapQuest Example)
The MapQuest site had 16.6 million user sessions and 3.7 million different users in Novemver 1999. In 2001, MapQuest delivers more than 185 million maps via the Internet monthly. (Source: AOL)
Others?
ESRI Web site...
On-line mapping facilities..
According to a recent research from ComScore Network (http://www.ebrandz.com/newsletter/2005/July/1july_31july_article1.htm) , online map users are a huge market. Currently,
| Time Warner's [MapQuest.com] has estimated 43.7 million U.S. visitors in May 2005, | |
| [Yahoo!Maps] has 20.2 million users, | |
| Google Map (maps.google.com) with 6.1 million and | |
| Microsoft's MSN MapPoint (mappoint.msn.com) has 4.68 million visitors, according to ComScore Networks. |
This is a huge market for online mapping services comparing to
traditional GIS users. It is interesting to see the new online mapping
providers, such as Google and Amozon to join the market of online mapping and
provide more diversified geospatial information services.
How many users for Google Earth?
Google Map? Google Map API?
Web Site Evaluation:
| HOW MANY? |
1. How many "hits" vs. "unique visitors". Many companies use server log analysis to evaluate how many users have been visited their web site. These numbers indicate how "valuable" these Web sites are.
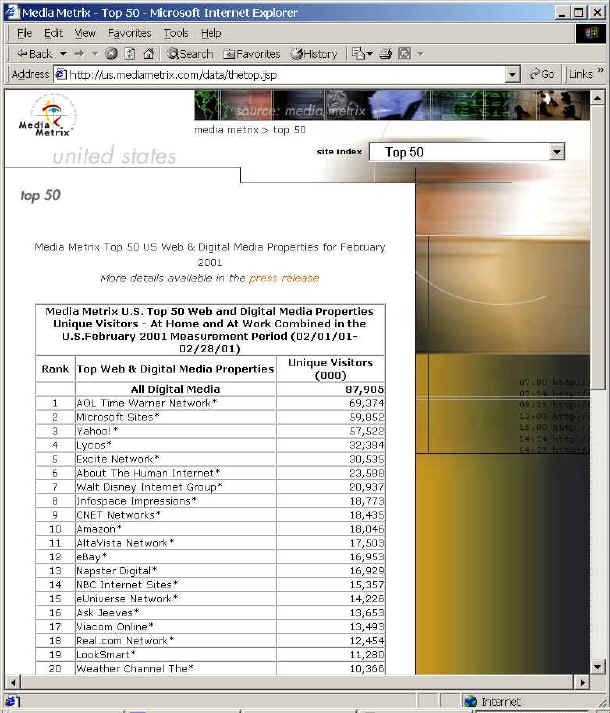
Data Source: Media Metrix.COM. ( http://www.mediametrix.com )
Actually, all Web servers have the capability to log EVERY SINGLE HTTP ACTIVITY automatically.
(You can ask the system administrators for locating these log files)
Here is the example of Web Server logs (in NCSA HTTP logs format). (Windows 2000: IIS Web Server from our class web site (GEOINFO.SDSU.EDU).
IP address -- TimeStamp -- Actions -- HTTP message (200, 206...)
65.54.188.109 - - [01/Apr/2007:00:02:23 -0800] "GET
/group2004/group4/topFrame.htm HTTP/1.0" 200
8602
65.54.188.109 - - [01/Apr/2007:00:08:36 -0800] "GET
/group2004Fall/group4/Website/Just+For+Fun.htm HTTP/1.0" 200 6268
122.152.128.48 - - [01/Apr/2007:00:08:53 -0800] "GET /index.htm HTTP/1.1" 200 0
65.55.208.235 - - [01/Apr/2007:00:18:22 -0800] "GET /group2005Spring/group1/raft_yuba.htm
HTTP/1.0" 200 6176
65.55.208.235 - - [01/Apr/2007:00:22:36 -0800] "GET /website/SDimage/ HTTP/1.0"
302 309
65.55.208.235 - - [01/Apr/2007:00:27:07 -0800] "GET /website/SDimage/index.htm
HTTP/1.0" 200 709
65.54.188.108 - - [01/Apr/2007:00:28:16 -0800] "GET /robots.txt HTTP/1.0" 404
4184
65.54.188.108 - - [01/Apr/2007:00:28:16 -0800] "GET /geo596/access-projects.htm
HTTP/1.0" 404 4184
65.54.188.109 - - [01/Apr/2007:00:28:19 -0800] "GET /robots.txt HTTP/1.0" 404
4184
65.54.188.109 - - [01/Apr/2007:00:28:20 -0800] "GET /group2007Spring/ HTTP/1.0"
200 1354
72.30.177.74 - - [01/Apr/2007:00:33:13 -0800] "GET /robots.txt HTTP/1.0" 404
4184
74.6.70.87 - - [01/Apr/2007:00:33:31 -0800] "GET /studentweb/g583-20/lab3.htm
HTTP/1.0" 304 141
65.54.188.109 - - [01/Apr/2007:00:34:27 -0800] "GET
/student581/g581-20/DW4_Destinations.html HTTP/1.0" 200 11682
65.54.188.109 - - [01/Apr/2007:00:34:27 -0800] "GET
/student581/g581-06/DW4_Destinations.html HTTP/1.0" 200 11680
65.54.188.109 - - [01/Apr/2007:00:34:33 -0800] "GET
/student581/g581-20/DW4_Travelog.html HTTP/1.0" 200 9444
65.54.188.109 - - [01/Apr/2007:00:34:34 -0800] "GET
/student581/g581-06/DW4_Travelog.html HTTP/1.0" 200 9444
66.249.72.196 - - [01/Apr/2007:00:54:48 -0800] "GET /website/fire2003d/TOCFrame.htm
HTTP/1.1" 304 140
65.54.188.108 - - [01/Apr/2007:00:55:47 -0800] "GET /geog104/lecture/unit-2.htm
HTTP/1.0" 200 222792
159.189.176.2 - - [01/Apr/2007:00:56:45 -0800] "GET /geo596/lab/lab9.htm
HTTP/1.1" 404 4203
66.249.72.196 - - [01/Apr/2007:01:02:03 -0800] "GET /gisbook/ch6.htm HTTP/1.1"
200 18021
74.6.87.48 - - [01/Apr/2007:01:03:20 -0800] "GET /robots.txt HTTP/1.0" 404 4184
74.6.85.226 - - [01/Apr/2007:01:03:21 -0800] "GET /soa/surveylist.htm HTTP/1.0"
304 141
65.55.208.242 - - [01/Apr/2007:01:09:35 -0800] "GET /robots.txt HTTP/1.0" 404
4184
65.55.208.242 - - [01/Apr/2007:01:09:35 -0800] "GET
/student581/g581-23/DW4_CompassHome2.htm HTTP/1.0" 404 4184
74.6.86.82 - - [01/Apr/2007:01:15:20 -0800] "GET /Fireweb/MobileGIS_GPS.htm
HTTP/1.0" 200 32520
74.6.86.153 - - [01/Apr/2007:01:23:22 -0800] "GET /visual/pages/shad_f_jpg.htm
HTTP/1.0" 200 711
128.194.135.94 - - [01/Apr/2007:01:33:28 -0800] "GET /fireweb/mobileGIS.htm
HTTP/1.1" 200 13404
72.30.226.172 - - [01/Apr/2007:01:33:42 -0800] "GET /robots.txt HTTP/1.0" 404
4184
72.30.226.134 - - [01/Apr/2007:01:33:56 -0800] "GET /index.htm HTTP/1.0" 200
75369
128.194.135.94 - - [01/Apr/2007:01:34:11 -0800] "GET /fireweb/GIS.htm HTTP/1.1"
200 10226
The number in the last field (200, 206, or.. ) is the status code in HTTP. For example: "200" means access the server successfully. "404" means that the request is "not found" on the server.
HTTP Status Code: http://www.w3.org/Protocols/HTTP/HTRESP.html
The Setting of the Server log files: (in Windows 2000 Server)
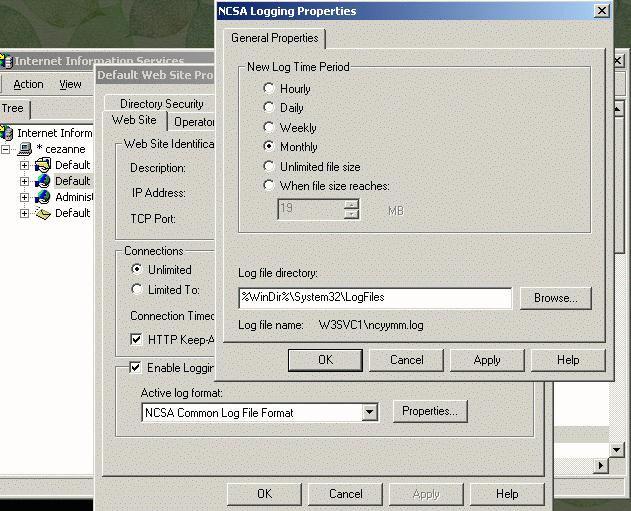
Another types of logs are the IIS server activities. (web publishing) Here are a few examples:
#Software: Microsoft Internet Information Services 6.0
#Version: 1.0
#Date: 2009-04-15 00:24:08
#Fields: date time c-ip cs-username s-sitename s-computername s-ip s-port cs-method
cs-uri-stem cs-uri-query sc-status sc-win32-status sc-bytes cs-bytes time-taken
cs-version cs-host cs(User-Agent) cs(Cookie) cs(Referer)
2009-04-15 00:24:08 130.191.118.166 group1 MSFTPSVC1 DEGAS 130.191.118.55 21
[104]USER group1 - 331 0 0 0 0 FTP - - - -
2009-04-15 00:24:08 130.191.118.166 group1 MSFTPSVC1 DEGAS 130.191.118.55 21
[104]PASS - - 230 0 0 0 32 FTP - - - -
2009-04-15 00:24:08 130.191.118.166 group1 MSFTPSVC1 DEGAS 130.191.118.55 21
[104]CWD 583group_2009/group1 - 250 0 0 0 0 FTP - - - -
2009-04-15 00:24:08 130.191.118.166 group1 MSFTPSVC1 DEGAS 130.191.118.55 21
[105]USER group1 - 331 0 0 0 0 FTP - - - -
2009-04-15 00:24:08 130.191.118.166 group1 MSFTPSVC1 DEGAS 130.191.118.55 21
[105]PASS - - 230 0 0 0 0 FTP - - - -
2009-04-15 00:24:08 130.191.118.166 group1 MSFTPSVC1 DEGAS 130.191.118.55 21
[105]CWD 583group_2009/group1 - 250 0 0 0 0 FTP - - - -
2009-04-15 00:24:13 130.191.118.166 group1 MSFTPSVC1 DEGAS 130.191.118.55 21
[106]USER group1 - 331 0 0 0 0 FTP - - - -
2009-04-15 00:24:13 130.191.118.166 group1 MSFTPSVC1 DEGAS 130.191.118.55 21
[106]PASS - - 230 0 0 0 0 FTP - - - -
2009-04-15 00:24:13 130.191.118.166 group1 MSFTPSVC1 DEGAS 130.191.118.55 21
[106]CWD 583group_2009/group1 - 250 0 0 0 0 FTP - - - -
2009-04-15 00:24:21 130.191.118.166 group1 MSFTPSVC1 DEGAS 130.191.118.55 21
[106]CWD _borders - 250 0 0 0 0 FTP - - - -
2009-04-15 00:24:21 130.191.118.166 group1 MSFTPSVC1 DEGAS 130.191.118.55 21
[106]CWD .. - 250 0 0 0 0 FTP - - - -
2009-04-15 00:24:21 130.191.118.166 group1 MSFTPSVC1 DEGAS 130.191.118.55 21
[106]CWD _derived - 250 0 0 0 0 FTP - - - -
2009-04-15 00:24:21 130.191.118.166 group1 MSFTPSVC1 DEGAS 130.191.118.55 21
[106]CWD .. - 250 0 0 0 0 FTP - - - -
2009-04-15 00:24:21 130.191.118.166 group1 MSFTPSVC1 DEGAS 130.191.118.55 21
[106]CWD _fpclass - 250 0 0 0 0 FTP - - - -
2009-04-15 00:24:21 130.191.118.166 group1 MSFTPSVC1 DEGAS 130.191.118.55 21
[106]CWD .. - 250 0 0 0 0 FTP - - - -
2009-04-15 00:24:21 130.191.118.166 group1 MSFTPSVC1 DEGAS 130.191.118.55 21
[106]CWD _overlay - 250 0 0 0 0 FTP - - - -
2009-04-15 00:24:21 130.191.118.166 group1 MSFTPSVC1 DEGAS 130.191.118.55 21
[106]CWD .. - 250 0 0 0 0 FTP - - - -
2009-04-15 00:24:21 130.191.118.166 group1 MSFTPSVC1 DEGAS 130.191.118.55 21
[106]CWD _private - 25
2009-04-15 17:43:57 130.191.118.226 group5 MSFTPSVC1 DEGAS 130.191.118.55 21
[108]USER group5 - 331 0 0 0 0 FTP
- - - -
2009-04-15 17:43:57 130.191.118.226 group5 MSFTPSVC1 DEGAS 130.191.118.55 21
[108]PASS - - 230 0 0 0 16 FTP - - - -
2009-04-15 17:43:57 130.191.118.226 group5 MSFTPSVC1 DEGAS 130.191.118.55 21
[108]CWD 583group_2009/group5 - 250 0 0 0 0 FTP - - - -
2009-04-15 17:43:57 130.191.118.226 group5 MSFTPSVC1 DEGAS 130.191.118.55 21
[109]USER group5 - 331 0 0 0 0 FTP - - - -
2009-04-15 17:43:57 130.191.118.226 group5 MSFTPSVC1 DEGAS 130.191.118.55 21
[109]PASS - - 230 0 0 0 0 FTP - - - -
2009-04-15 17:43:57 130.191.118.226 group5 MSFTPSVC1 DEGAS 130.191.118.55 21
[109]CWD 583group_2009/group5 - 250 0 0 0 0 FTP - - - -
2009-04-15 17:44:00 130.191.118.226 group5 MSFTPSVC1 DEGAS 130.191.118.55 21
[110]USER group5 - 331 0 0 0 0 FTP - - - -
2009-04-15 17:44:00 130.191.118.226 group5 MSFTPSVC1 DEGAS 130.191.118.55 21
[110]PASS - - 230 0 0 0 15 FTP - - - -
2009-04-15 17:44:00 130.191.118.226 group5 MSFTPSVC1 DEGAS 130.191.118.55 21
[110]CWD 583group_2009/group5 - 250 0 0 0 0 FTP - - - -
2009-04-15 17:44:13 130.191.118.226 group5 MSFTPSVC1 DEGAS 130.191.118.55 21
[110]CWD _borders - 250 0 0 0 15 FTP - - - -
2009-04-15 17:44:13 130.191.118.226 group5 MSFTPSVC1 DEGAS 130.191.118.55 21
[110]CWD .. - 250 0 0 0 0 FTP - - - -
2009-04-15 17:44:13 130.191.118.226 group5 MSFTPSVC1 DEGAS 130.191.118.55 21
[110]CWD _derived - 250 0 0 0 16 FTP - - - -
2009-04-15 17:44:13 130.191.118.226 group5 MSFTPSVC1 DEGAS 130.191.118.55 21
[110]CWD .. - 250 0 0 0 0 FTP - - - -
2009-04-15 17:44:13 130.191.118.226 group5 MSFTPSVC1 DEGAS 130.191.118.55 21
[110]CWD _fpclass - 250 0 0 0 0 FTP - - - -
2009-04-15 17:44:13 130.191.118.226 group5 MSFTPSVC1 DEGAS 130.191.118.55 21
[110]CWD .. - 250 0 0 0 0 FTP - - - -
2009-04-15 17:44:13 130.191.118.226 group5 MSFTPSVC1 DEGAS 130.191.118.55 21
[110]CWD _overlay - 250 0 0 0 0 FTP - - - -
2009-04-15 17:44:13 130.191.118.226 group5 MSFTPSVC1 DEGAS 130.191.118.55 21
[110]CWD .. - 250 0 0 0 0 FTP - - - -
2009-04-15 17:44:13 130.191.118.226 group5 MSFTPSVC1 DEGAS 130.191.118.55 21
[110]CWD _private - 250 0 0 0 0 FTP - - - -
![]()
The Analysis Software: Hundreds of software packages are available now. Some of them are free. Some of them are very expensive).
Problems: Most server log-files estimate Unique Visitor counts from "cookies" and /or IP address, which are approximations for unduplicated users of a Web site. The limitation is that a cookies or IP address identifies a single unique browser (such as IE or Netscape) on a machine which may be used by multiple persons in a home, office or public places, and result in an undercount of individual users. Also, if a person use a ISP with assigning dynamic IP addresses, the number will be overestimated. Different measurement methodologies will produce different results. (Source: Media Metrix.COM http://us.mediametrix.com/products/methodologies.jsp )
![]()
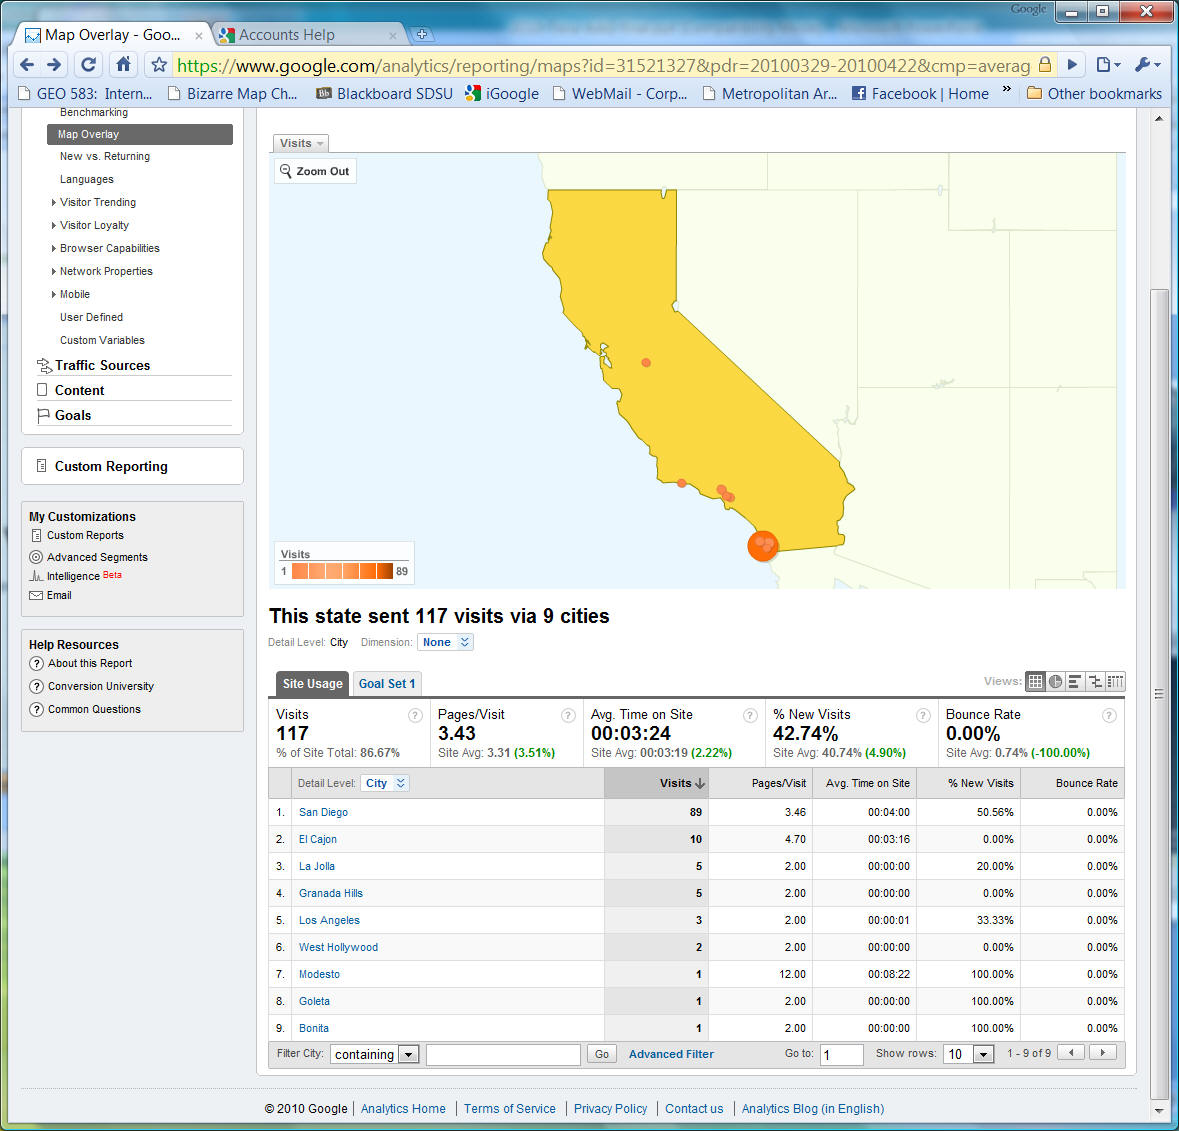
We can tell where the users come from because we see the IP addresses.
For example, 64.68.82.28 is geographically located in Mountain View California, 211.76.240.245 is accessing from Taipei Taiwan, 4.42.194.225 from Ft. Forth Texas, 134.129.59.121 from Fargo North Dakota, 217.228.254.210 from Munich Germany and 202.83.162.42 from Peshawar Pakistan. These locations were found using GeoBytes IP Address Locator Tool (http://www.geobytes.com/IpLocator.htm?GetLocation),
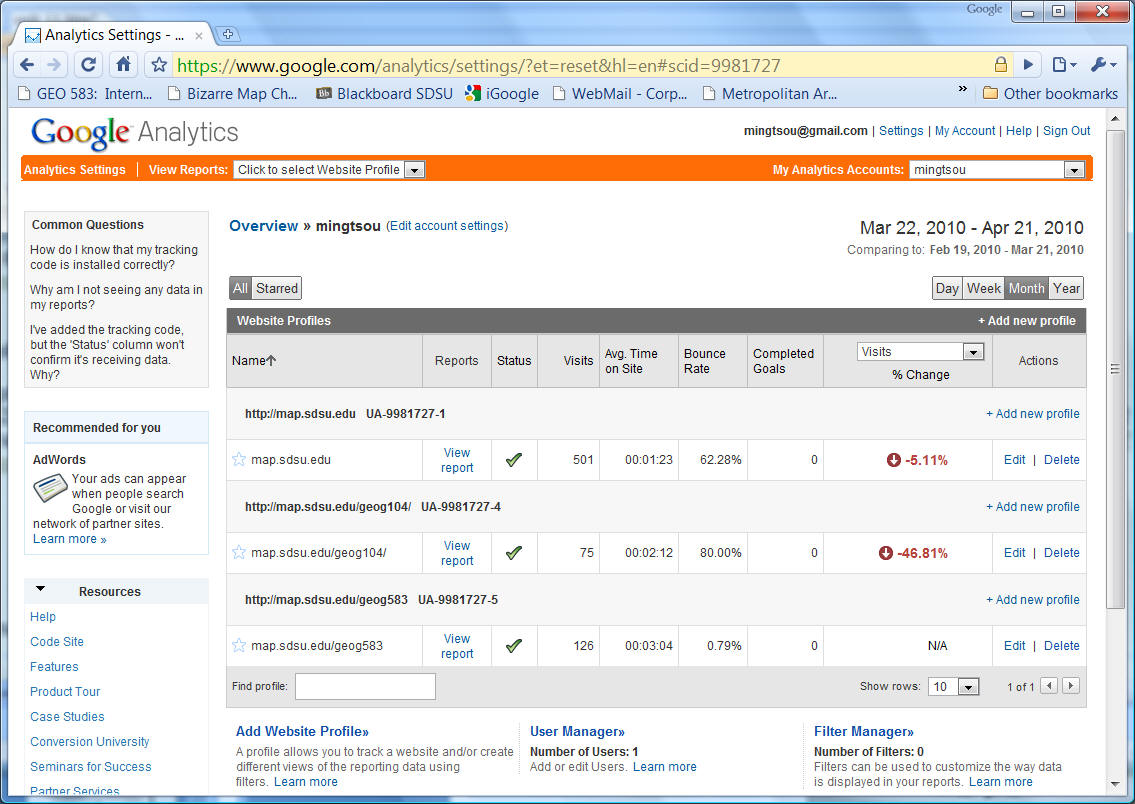
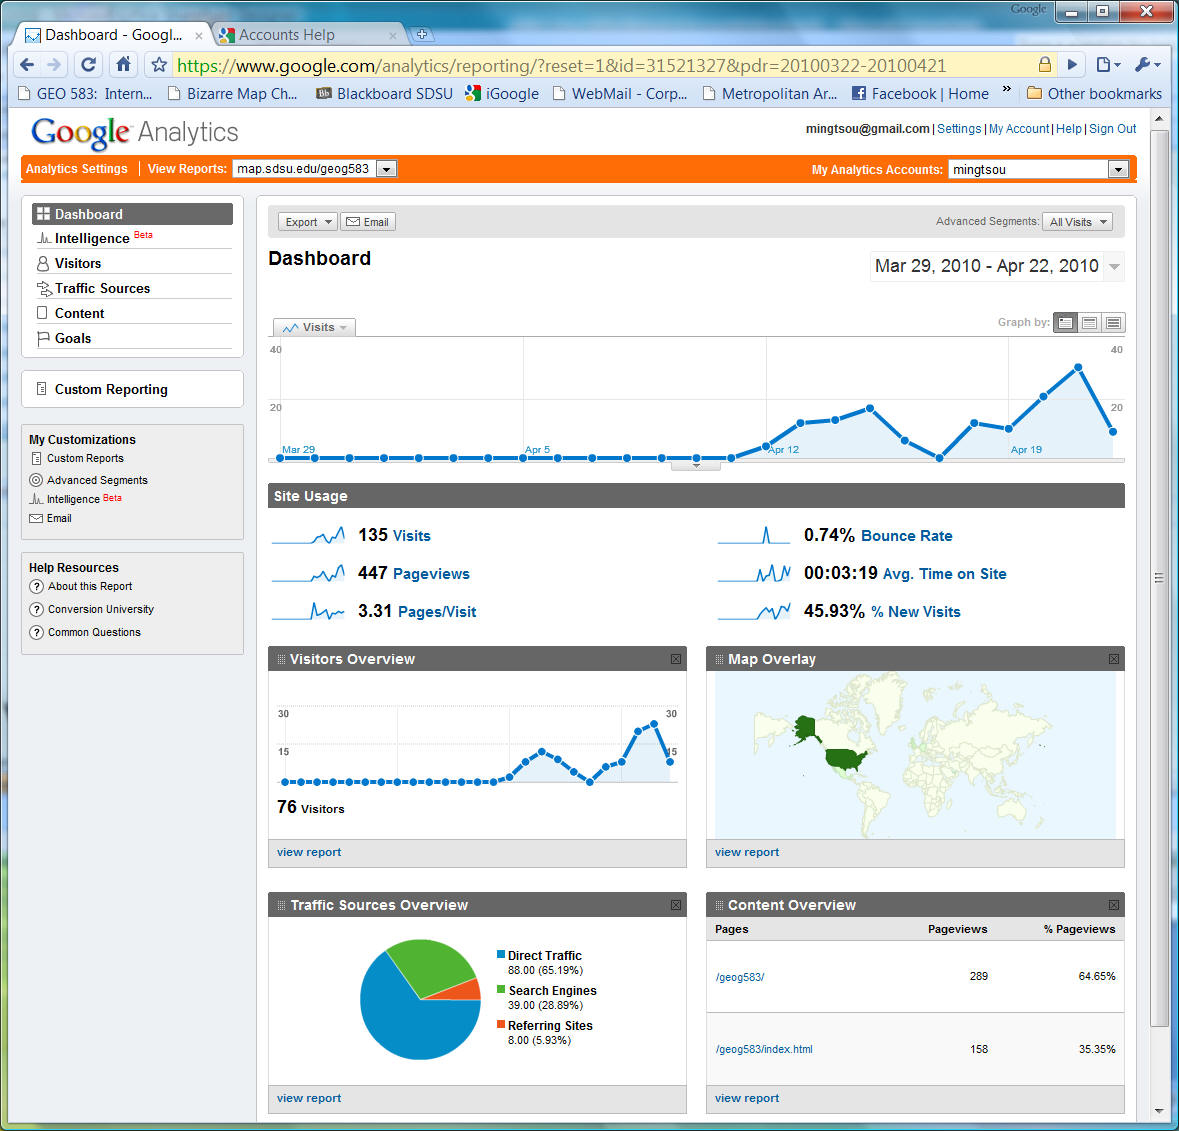
Google Analytics
https://www.google.com/analytics/settings/?et=reset&hl=en#scid=9981727
![]()
| WHO ARE THE USERS? |
1. On-line customer information. (by form survey)
3. user behavior analysis (shopping, web browsing..). Compare the actual product sales information with on-line user databases. Also with Web "cookies", the company can track individual's behaviors more precisely.

3. User Random sampling survey. (on-line or off-line)
Users can download a specific program and install it on their local machines. This program will be able to track all user behaviors and actions and to send out these information back to the server automatically.
![]()
Digital Divide
![]()
Although the Internet can provide useful and essential information for the public, the Internet-based information services also have some negative aspects. The major problem is the creation of Information Ghetto (Graham and Marvin, 1996) and Digital Divide (NTIA, 1999). Even though society uses computer technology and network facilities as the major tools to provide public information services for its citizens, some people will be deprived of their civil rights and miss the opportunities for success due to the lack of tools for accessing public information services.
While affluent and elite groups are beginning to orient themselves to the Internet and home informatics and telematics systems, other groups are excluded by price, lack of skills or threaten to be exploited at home by such new technologies. Advanced telecommunications and transport networks open up the world to be experienced as a single global system for some. But others remain physically trapped in ‘information ghettos’ where even the basic telephone connection is far from a universal luxury (Graham and Marvin, 1996, p 37).
The similar problem was also identified in research on the Digital Divide carried out by the National Telecommunications and Information Administration (NTIA), U.S. Department of Commerce. NTIA initiated their first survey in 1994, then continued it in 1997 and 1998. These surveys discovered that "the situation of Digital Divide – the divide between those with access to new technologies and those without – is now one of America’s leading economic and civil right issues" (NTIA, 1999. P. xiii).
The survey identified user profiles of telephone services and Internet access and cross-tabulated the information according to several variables (such as income, race, age, and education) in three geographic categories -–rural, urban and central city.
The first report identified the problem of disproportionate access to the Internet in rural areas and central cities. "Black households in central cities and particular rural areas have the lowest percentages of PCs, with central city Hispanics also ranked low" (NTIA, 1995, p.3). Two years later, the second survey indicated the widening gap of the Digital Divide along with the popular growth of Internet and PCs. The results also indicated that the group of female-headed households lag significantly behind the national average of Internet access and PC usage (NTIA, 1998). The third report released in 1999 found that "a Digital Divide still exists, and, in many cases, is actually widening over time. Minorities, low-income persons, the less educated, and children of single-parent households, particularly when they reside in rural areas or central cities, are among the groups that lack access to information resources" (NTIA, 1999, p. xiii). For example, "urban households with incomes of $75,000 and higher are more than twenty times more likely to have access to the Internet than rural household at the lowest income levels, and more than nine times as likely to have a computer at home" (NTIA, 1999, p. xv).
In general, the Digital Divide reports indicate that provision of public services require in-depth considerations beyond the deployment of technology. The social aspect of public access needs to be considered while local or federal governments deploy the framework of distributed services. Internet technology and distributed GIServices should help the public, especially those who need additional support from the governments and social welfare. NTIA’s research also reveals that "many of the groups that are most disadvantaged in terms of absolute computer and modem penetration are the most enthusiastic users of on-line services that facilitate economic uplift and empowerment" (NITA, 1995, p 4.).
Besides the adoption of network technology and real-time information services, government may need to provide public facilities for the public to access these information and the Internet in local public libraries, schools, and community centers. Also, some essential geographic information may use alternative media for the public, such as paper maps, telephone services, or public broadcast systems. In general, distributed GIServices should allow the public to access essential information from both public and private places and should not be limited to certain societal groups or classes.
![]()
Unit 11
(Session Two):
![]()
User Interface Evaluation
Philosophy and specific methods for evaluations.
| Productivity | |
| Figures of merit (e.g., time, errors, learnability, design for guessing, preference, etc.) | |
| Usability testing techniques, linking testing to specifications | |
| Formative and summative evaluation techniques for empirical evaluation, including, field observation methods, participant observation, interviewing techniques, questionnaire design, psychometric methods, video protocols, system logging, experiment design (e.g, concern with sample bias, etc.), methods from psychological and sociological evaluation fields, ethics of working with participants. |
(source: Curricula for Human-Computer Interaction (ACM SIG CHI) http://www.acm.org/sigchi/cdg/cdg2.html#2_1 )
The following evaluation methods are introduced by this book:
Shneiderman, B. (1998). Designing the User Interface: Strategies for Effective Human-Computer Interaction (Third ed.). Reading, Massachusetts: Addison-Wesley.
Expert Reviews:
Experts or Consultants who are in the application or user-interface domains can provide a formal report with problems identified or recommendations for changes. methods: Heuristic evaluation, Guidelines review, Consistency inspection, Cognitive walkthrough, and formal usability inspection.
Usability Testing
Think-aloud Video Taping: Field Test ( put new interfaces to work in realistic environments for a fixed trial period). Can-you-break-this Competitive usability testing (compare a new interface to previous versions)
Surveys
User survey: clear goal in advance.. Online survey: avoid cost and printing, distributing, and collecting paper forms. The Questionnaire for User Interaction Satisfaction (QUIS): http://www.lap.umd.edu/quis
Norman, K. L., Friedman, Z., Norman, K. D., & Stevenson, R. (2000). Navigational Issues in the Design of On-Line Self Administered Questionnaires (HCIL-TR-2000-10, LAP-TR-2000-01)
Continuing Assessments:
| Interviews | |
| Focus-group discussion | |
| Continuous user-performance data logging | |
| Online or telephone consultant (ArcOnline: http://arconline.esri.com/ ) | |
| Online suggestion box or trouble reporting | |
| Newsgroup ( ArcIMS Discussion Forum: http://forums.esri.com/forums/index.cfm?CFApp=64 ) | |
| User newsletters and User conferences (ESRI www.esri.com ) |
Reference: (under construction)
National Telecommunications and Information Administration (NTIA) (1995). Falling Through the Net: A Survey of "Have nots" in Rural and Urban America. NTIA, U. S. Department of Commerce.
National Telecommunications and Information Administration (NTIA) (1998). Falling Through the Net II: New Data on the Digital Divide. NTIA, U. S. Department of Commerce.
National Telecommunications and Information Administration (NTIA) (1999). Falling Through the Net: Defining the Digital Divide: A Report on the Telecommunications and Information Technology Gap in America. NTIA, U. S. Department of Commerce. URL:
http://www.ntia.doc.gov/ntiahome/digitaldivide/ (date: 5-11-2000).2004: A Nation Online: Entering the Broadband Age, http://www.ntia.doc.gov/reports/anol/index.html
![]()
![]()
![]()
![]()
![]()