Web-based Exercise #4:
GIS Applications.
Under-Construction --- Do not work on this exercise yet.
Estimated Time: 4 hours
Grading: 10 points total (Two points for Q1, Q2, Q3, Q4. One point for Q5, Q6).
Learning Goal: This module will introduce various GIS applications and illustrate their usefulness in different specialty areas such as political science (election campaign fundraising), criminal justice (crime mapping and tracking), business and marketing (real estate sales and pricing), and environmental science/ecology (environmental monitoring & management).
Platforms: PC, Mac, or UNIX.
Software Tools Required: Web browser with high-speed Internet access.
Due Day: Apr. 19 at the beginning of lecture (11:00am). You should upload your lab answers to the Blackboard (http://blackboard.sdsu.edu) before the lecture and submit a paper print-out version in the class. We will use the Timestamp on your documents in the Blackboard to check if your assignment is late or not.
(In your upload file, please use this title: GEOG104-LAB-4-[Your name].doc (or txt or pdf). Please write down your answers in MS Word or WordPAD or other word processing software. Please always save a local backup copy of your own answers.)
(If you don't have the Internet access, you can use our SAL lab (Storm Hall 338, third floor) on every Friday morning from 11:00am to 12:00pm.
1. Political Science - Election Campaign Fundraising (FundRace Money Map).
GIS can be used in many useful applications. One of the most interesting applications is for election campaign fundraising. Different political parties and election candidates can use GIS to strategize and analyze their political campaigns, voter landscapes, and fundraising. The following GIS application for the 2008 U.S. Presidential election is a notable example:
To begin, launch your Web Browser (with a live connection to the Internet). Navigate to http://fundrace.huffingtonpost.com/. Then select "2008" on the upper-right corner of the map (2 in the Figure 1). A map of the United States will appear illustrating the campaign fundraising distribution of the 2008 election (Figure 1). This website informs you who donates, where the donor lives, how much the donor contributes, etc. If you click on some points on the map, you can see the donor lists on the right hand side of the web site. The default map shows the fundraising distribution of each party (Red dots for Rep. and Blue dots for Dem.). You can zoom in and out by using the navigation controls (1 in the Figure 1), and move the map position by dragging your mouse.
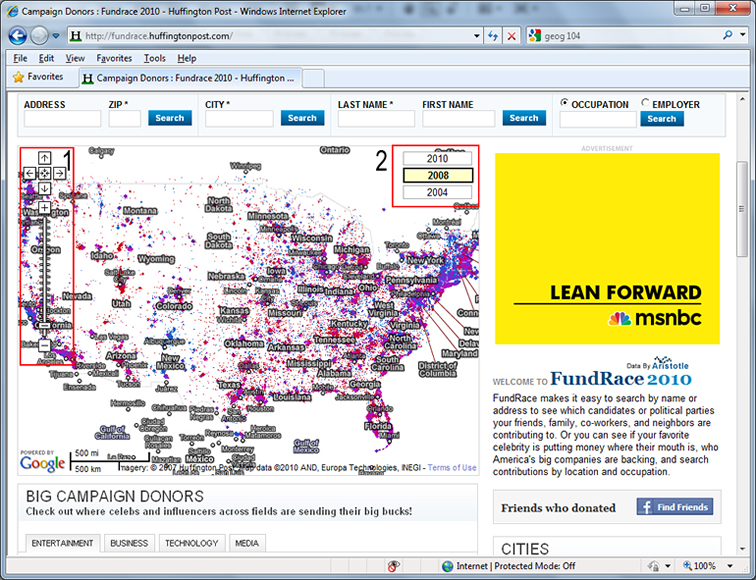 Figure 1: The
HUFFINGTON POST FUNDRACE 2008
Figure 1: The
HUFFINGTON POST FUNDRACE 2008
Q1-a: What do you think about this FUNDRACE 2008 map of the United States? What are strengths and weaknesses of the map?
Zoom and drag to San Diego County like Figure 2 (or you can search for San Diego by CITY, and then zoom out to San Diego County). Also, select "2008" on the upper-right corner of the map.
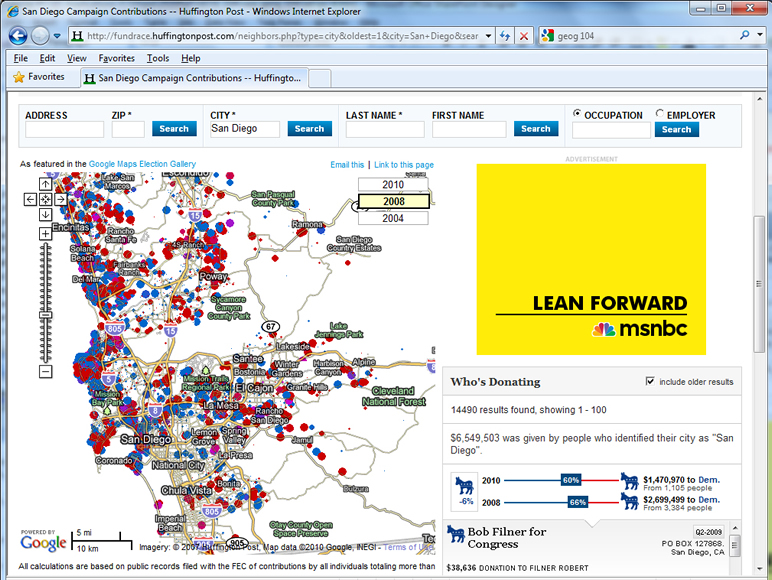
Figure 2: FundRace Democrat vs. Republican in San Diego
Q1-b: What are the geographical patterns of the fundrace 2008 of each party in San Diego County in Figure 2? How can you interpret this map? (Please, disregard the purple dots)
Q1-c: Input your zipcode in the "ZIP" text box on the web page, and click on "Search" button. On the right hand side, you can see the summary of the donors (scroll down the web page to look at more donors). How many people donated? Also, How much do they contribute? Do you think that this information lets you know the political trends in your zipcode area?
Q1-d: If you were currently campaigning to become the President of the United States, how would you use the information in these maps to your advantage and why?
2. Criminal Justice - Crime Mapping and Tracking (City of San Diego Crime Map).
The second GIS application example can be used to study and visualize reported criminal incidents and the locations were they occurred. This is an example of a “Crime Map.” A Web-based mapping tool was developed for the Automated Regional Justice Information System (ARJIS), a computer network utilized by 50 local, state and federal agencies in the San Diego region. Finish the exercises and answer the question 2.
To begin, launch your Web Browser (with a live connection to the Internet). Navigate to http://www.arjis.org scroll down the web page, and then click on the link named, Crime Maps. A new Web page will pop up (If you are using Microsoft Internet Explorer as your Web browser and you receive a message indicating that the pop-up was blocked, hold down the <Control> key and click on the Crime Maps link to bypass the Pop-Up Blocker.)
On the Crime Maps Disclaimer page which pops up, click on the Accept button to continue. Now, on the next page, click on the Go to Mapping button. The Regional Crime Maps Web interface should appear.
Under Jurisdiction, click on San Diego (The “plus sign” next to San Diego will list the neighborhoods in San Diego City. Since we need to select all neighborhoods in San Diego City, just click on San Diego).
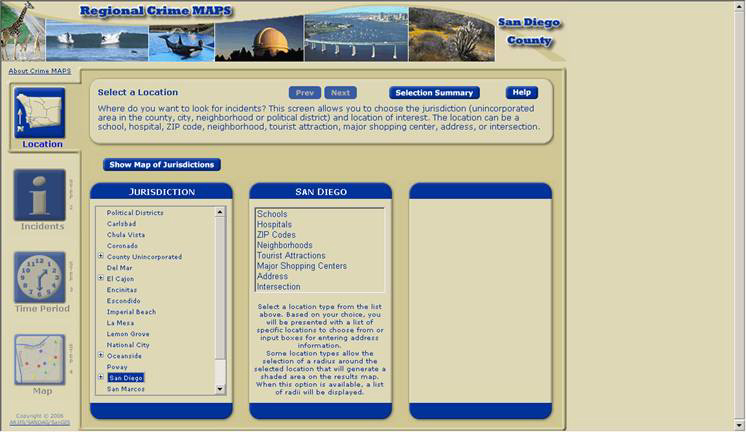 Figure 3: Regional Crime Maps
A column named San Diego will appear. In this column, choose Address and a third column will appear. In the third column, enter your home or high school street address (if you live or go to school in the City of San Diego). If you don’t reside in the City of San Diego, type 5500 Campanile Dr. (the street address of San Diego State University) and click on Verify Address. If multiple addresses appear, choose any one that is closest to your actual address. After verifying the address, choose 1 mile from the pull-down menu under “Radius for shaded area around selected location.” This is known as a “buffer area” and will display all of the incidents within a one-mile radius. After setting the buffer area, click on the Next button toward the center-top of the browser window. A column of Incident Types should appear.
Under Incident Types, choose all types of Crimes by checking all of the criminal incident types under the Crimes folder. You can either select each incident individually or you can select all of them under the folder by clicking on the folder icon next to Crimes (Figure 4). Again, for this exercise, select all types of Crime. If you are curious, the right column lists the definitions of these incident types. When finished selecting, click on the Next button toward the center-top of the browser window. Controls to select the incident time period should appear.
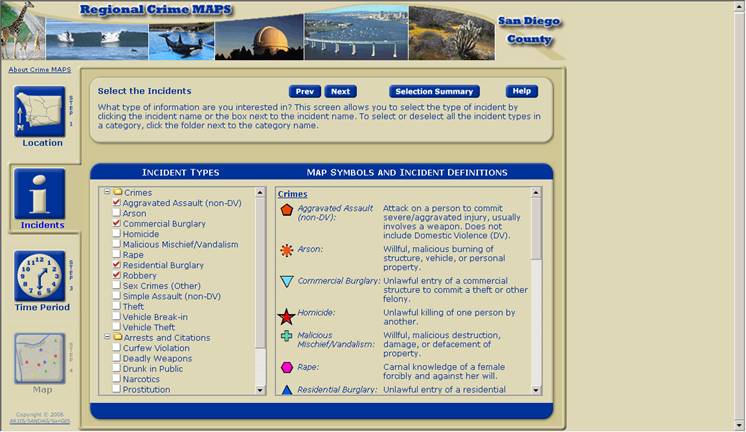 Figure 4: Creating
Regional Crime Maps
Figure 4: Creating
Regional Crime Maps
You can look up the incidents that have been stored in the system by selecting a range of dates, days of the week, and time range. For now, leave the Date Range and Time Range and Days of Week as is. It is automatically set for the last month.
Under Date Range on the left column, the top calendar is used to set the start date. The bottom calendar is used to set the stop date. The right column, Time Range and Days of Week, can be used to select specific days of the week and time of day. Again, leave everything as is and click on the Next button toward the center-top of the browser window
A map should appear shortly displaying the immediate area around the address you selected (Figure 5). There may or may not be any incidents recorded around the location for the given time period. Incidents are denoted by icons on the map. In the Example Crime Map image following this paragraph, you can see several icons including green plus signs (vandalism), yellow dots (theft), and blue triangles (residential burglary). If you don’t see any incidents, you may want to choose a different location by clicking on the Location button on the top-left of the map and resetting the location with the previous steps. You can also use the Zoom Out and Zoom In controls on the right side of the map to change the map areas displayed. If you still don’t see any incidents, you may also want to expand the date range to cover several months instead of just the default single month in the Time Period menu. After changing any of the settings, you can redisplay the map by selecting the Map button on the lower-left corner.
Now, you can get more information about an incident by selecting the Identify button on the right side of the map, and clicking on any incident icon.
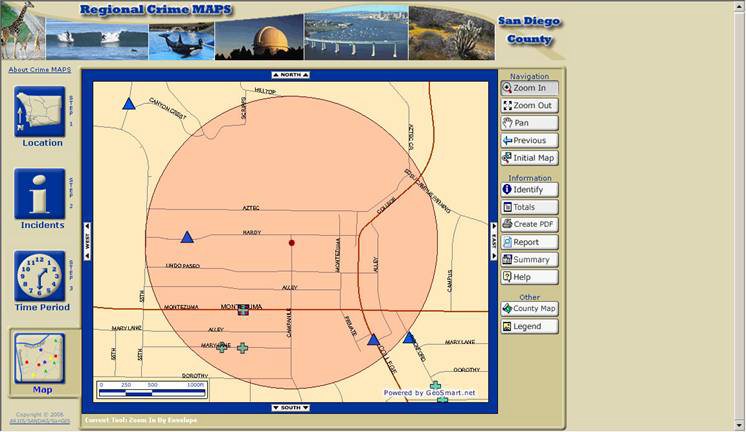
Figure 5: Customized Crime Maps
You can change the Location, types of Incidents, and Time Period by clicking on the respective buttons on the left side of the map. After changing your selection, click on Map button to redisplay your map. This system covers all areas in San Diego County. You can look up any street address, city and zip code within San Diego County. Please create crime maps with different combinations of Location, types of Incidents, and Time Period settings.
Now, Please answer the following Q2 questions:
Q2-a: Create a crime map for any area you are interested in. What are your selected Location, Incident Types and Time Period? What are the geographical patterns of the crimes in the crime map?
Q2-b: For Location, select San Diego in the Jurisdiction column, select Neighborhoods in the San Diego column, and select "Pacific Beach" in the Neighborhoods column. For Incidents, select only "Malicious Mischief/Vandalism" in the Incident Types column. For Time Period, set Date Range from Jan. 1th to Jan. 30th. And then click on "Map". How many incidents are there?
Q2-c: For Location, select San Diego in the Jurisdiction column, select Major Shopping Centers in the San Diego column, and select "Horton Plaza" in the Major Shopping Centers column. For Incidents, select all "Crimes" types. For Time Period, set Date Range from Sept. 1th to Sept. 30th. And then click on "Map". What types of incidents are most frequent in the crime map? What are the geographical patterns of the incidents (Refer to the street names)?
Q2-d: If you were the mayor of the City of San Diego, how could you use this system to improve the safety of San Diego visitors and residents and why?
3. Business and Marketing - Real Estate Sales and Pricing (Real Estate Housing Costs with Zillow.com).
This example will introduce GIS applications in private industry, business, and commerce. Many companies have been utilized GIS for promoting their businesses and to increase their profits. They do this by conducting market analysis, and new store and distribution center site-selection studies. GIS can combine information about the cost of land, the cost of local taxes, the local laws and regulations (zoning), the distance to the sales locations (or retail outlets), and the types of customers within the local area (demographic analysis). Using all of this information and more, decision makers can make better business management choices.
The following example introduces a unique GIS application in the Real Estate business specialty area. This application estimates home values based on recent sales in the area of equivalent homes in the area.
To begin, launch your Web Browser (with a live connection to the Internet) and navigate to http://www.zillow.com.
Next, type in the street address of a home. If you don’t have the entire street address, it is also okay to just type the street name without the address number. Then, type in the city where that address is located, and either the state abbreviation or zip code.
As an example (given in the figure above), type in 5454 Mary Lane Dr. San Diego in the Find Home values and listingstext field, and then click on the "Search" button.
A map should appear showing the area around the address you typed along with residences and home prices (Figure 6) (If you cannot see the home prices, you need to zoom in more). You can navigate around the map once it is displayed. You can zoom in and zoom out the map by the control on the upper-left corner of the map (It is labeled, Homes, Street, City, State, USA). You can also move the map position by dragging your mouse. Depending on how far you zoom in or out (setting the map scale), you can change the level of details. Try several different addresses. Make sure the estimated home prices are visible. Note that the home prices $400K means $400,000.
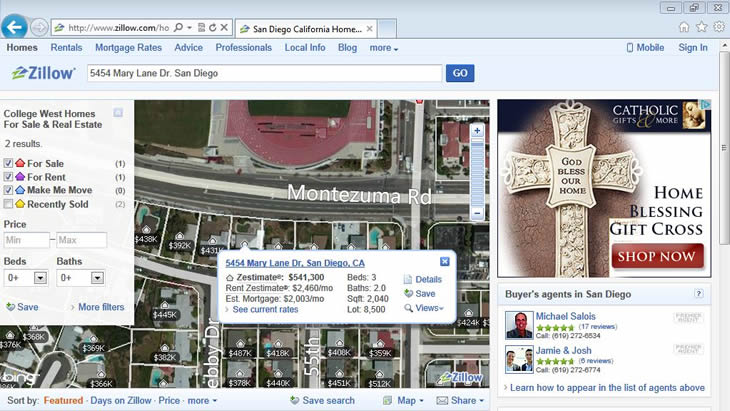
Figure 6: Homes around Mary Lane Drive
Now, Please answer the following Q3 questions:
Q3-a: Select a home which you are interestd in. Then click on the home and check its estimated value. What is the street name of your selected home? What is the estimated value of your selected home? What is the estimated value of the neighboring home in the east (or the north) of your selected home? What is the estimated value of the neighboring home in the west (or the south) of your selected home? What are the differences in the estimated values between the three homes?
Q3-b: Click on the first home which you selected in Q3-a, and look at a pop-up window with more information. In the same way, look at more information of the neighboring homes that you chose in Q3-a. Why do you think that their estimated values are different notwithstanding that they are contiguous to each other (Hint: Beds, Baths, Sqft, Lot, and Built)?
Q3-c: If you wanted to buy a home in San Diego, how could you use this Website to select the home?
4. Environmental Science/Ecology - Environmental Monitoring & Management (San Diego Watershed Common Ground Website).
This section will introduce GIS applications in environmental science and ecology with specific examples for environmental monitoring and management tasks. Many federal agencies, such as the U. S. Geological Survey (USGS) and the Environmental Protection Agency (EPA), and local governments have been using GIS to manage their watersheds, water supplies, wildlife, wetlands. The following example will introduce a research project developed through the collaboration of the SDSU Geography Department, the City of San Diego, a private environmental consulting company, and San Diego Coastkeeper (a non-profit environmental advocacy group).
To begin, launch your Web Browser (with a live connection to the Internet) and navigate to http://www.sdbay.sdsu.edu (Figure 7).
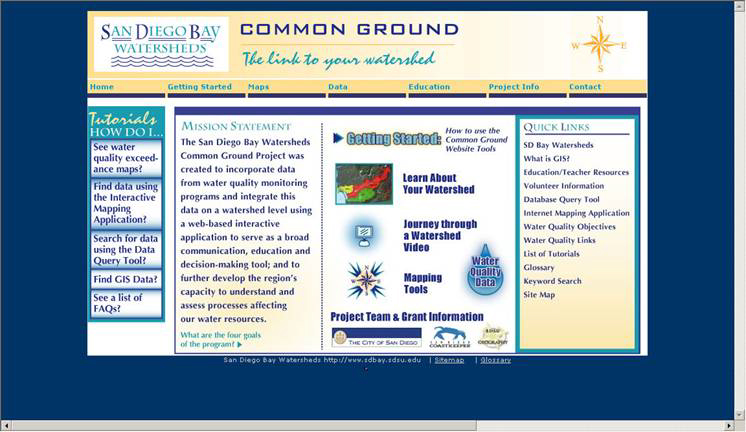
Figure 7: The Common Ground Project for San Diego Bay Watersheds
After the Web page opens, click on the link, Journey through a Watershed Video. Watch the 4-minute multimedia video (You will need to have a multimedia video player on your computer such as Microsoft’s Windows Media Player, RealPlayer, or another multimedia video player that plays back the .WMV media format). (This video was developed with Google Earth Pro and a video editing application (Video Studio 9).
Close the multimedia video player window and switch back to the Website (http://www.sdbay.sdsu.edu ). On the right side of the window, there are several Web links listed under Quick Links. Select the What is GIS? link and spend five minutes reading the Webpage contents.
Now select the Maps pull-down menu at the topic of the Web page, then select Interactive from the list. A disclaimer page will appear. Scroll down to the bottom of the Maps Disclaimer page, and click on the Agree button to proceed to the Interactive Map. (If you are using Microsoft Internet Explorer as your Web browser and you receive a message indicating that the pop-up was blocked, hold down the <Control> key and click on the Agree or Allow Once button to bypass the Pop-Up Blocker.)
A new map window should pop up (Figure 8). On the right side of the window, you will see a list of layers which organize water quality data around the San Diego region. Click and place a check mark in the square “check box” next to the Pueblo Watershed in the Layers list to display it in the map. The map will be updated with your chosen information. Also, select the circular “radio button” of the same layer---the Pueblo Watershed. This will make the layer “active” and will allow you to explore the Pueblo Watershed data interactively on the map. You should now see water quality monitoring sites on the map. They are highlighted with bright pink circular markers.
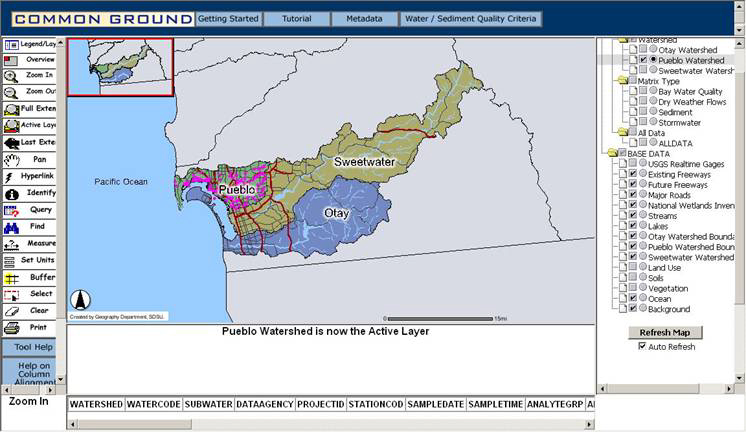
Figure 8: Interactive Maps for San Diego Watersheds
On the left side of the map, click the Zoom In button to activate the Zoom In control. Next click and drag a rectangular box around the area with the pink water quality monitoring sites (See Figure 9). After you have successfully zoomed in to the area where most of the water quality monitoring sites are located, click on the Identify tool located on the left side of the map to activate it. Now, select one of the Pink water quality monitoring points on the map. If successful, the system will check the database of the water quality monitoring station located at your selected site and display the information in a table below the map (Figure 9). Use the scroll bar below the data to briefly examine the data and feel free to check the data at other water quality monitoring sites (the pink dots).
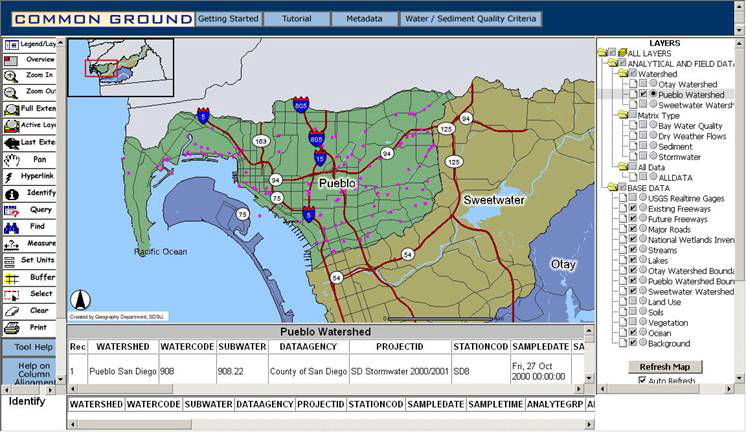
Figure 9: Displaying Water Quality Monitoring Data
Now, Please answer the following Q4 questions:
Q4-a: Based on the video, where did the pollutants come from? Where did the pollutants end up? What kinds of pollutants are there? What can you do to help keep San Diego Bay clean?
Q4-b: How can you use this system to monitor the water quality in your neighborhood?
Q5 (one point): Please discuss which application you liked the best and tell us why? Do How can it help people?
Q6 (one point): Please tell us if it was difficult or easy to access the Web GIS maps using your Web browser. Why was it easy or difficult? What are the advantages of using Web GIS? What do you think current Web GIS?
Summary of GIS Web Applications
Now that you have seen four Web-based GIS applications examples in four different fields, please think about what you have learned and try to answer the following questions.
Web-based Exercise #4:
Due Day: Apr. 5 at the beginning of lecture (11:00am). You should upload your lab answers to the Blackboard (http://blackboard.sdsu.edu) before the lecture and submit a paper print-out version in the class. We will use the Timestamp on your documents in the Blackboard to check if your assignment is late or not.
(In your upload file, please use this title: GEOG104-LAB-4-[Your name].doc (or txt or pdf). Please write down your answers in MS Word or WordPAD or other word processing software. Please always save a local backup copy of your own answers.)
Grading: 10 points total (Two points for Q1, Q2, Q3, Q4. One point for Q5, Q6).
Q1 questions ( two points)
Q1-a: What do you think about this FUNDRACE 2008 map of the United States? What are strengths and weaknesses of the map?
Q1-b: What are the geographical patterns of the fundrace 2008 of each party in San Diego County in Figure 2? How can you interpret this map? (Please, disregard the purple dots)
Q1-c: Input your zipcode in the "ZIP" text box on the web page, and click on "Search" button. On the right hand side, you can see the summary of the donors (scroll down the web page to look at more donors). How many people donated? Also, How much do they contribute? Do you think that this information lets you know the political trends in your zipcode area?
Q1-d: If you were currently campaigning to become the President of the United States, how would you use the information in these maps to your advantage and why?
Q2 questions ( two points)
Q2-a: Create a crime map for any area you are interested in. What are your selected Location, Incident Types and Time Period? What are the geographical patterns of the crimes in the crime map?
Q2-b: For Location, select San Diego in the Jurisdiction column, select Neighborhoods in the San Diego column, and select "Pacific Beach" in the Neighborhoods column. For Incidents, select only "Malicious Mischief/Vandalism" in the Incident Types column. For Time Period, set Date Range from Jan. 1th to Jan. 30th. And then click on "Map". How many incidents are there?
Q2-c: For Location, select San Diego in the Jurisdiction column, select Major Shopping Centers in the San Diego column, and select "Horton Plaza" in the Major Shopping Centers column. For Incidents, select all "Crimes" types. For Time Period, set Date Range from Sept. 1th to Sept. 30th. And then click on "Map". What types of incidents are most frequent in the crime map? What are the geographical patterns of the incidents (Refer to the street names)?
Q2-d: If you were the mayor of the City of San Diego, how could you use this system to improve the safety of San Diego visitors and residents and why?
Q3 (2 points)
Q3-a: Select a home which you are interestd in. Then click on the home and check its estimated value. What is the street name of your selected home? What is the estimated value of your selected home? What is the estimated value of the neighboring home in the east (or the north) of your selected home? What is the estimated value of the neighboring home in the west (or the south) of your selected home? What are the differences in the estimated values between the three homes?
Q3-b: Click on the first home which you selected in Q3-a, and look at a pop-up window with more information. In the same way, look at more information of the neighboring homes that you chose in Q3-a. Why do you think that their estimated values are different notwithstanding that they are contiguous to each other (Hint: Beds, Baths, Sqft, Lot, and Built)?
Q3-c: If you wanted to buy a home in San Diego, how could you use this Website to select the home?
Q4 (2 points)
Q4-a: Based on the video, where did the pollutants come from? Where did the pollutants end up? What kinds of pollutants are there? What can you do to help keep San Diego Bay clean?
Q4-c: How can you use this system to monitor the water quality in your neighborhood?
Q5 (1 point): Please discuss which application you liked the best and tell us why? Do How can it help people?
Q6 (1 point): Please tell us if it was difficult or easy to access the Web GIS maps using your Web browser. Why was it easy or difficult? What are the advantages of using Web GIS? What do you think current Web GIS?
