Remote sensing and digital image processing are geo-spatial tools that can support many aspects of fire management. This normally involves the processing and analysis of images captured with sensors on aircraft or satellite platforms. Image-derived products are used for pre-fire assessments of fire risk, real-time mapping of fire extent and movement, and post-fire analysis of burn extent and severity, and recovery from fire.
Pre-fire Risk
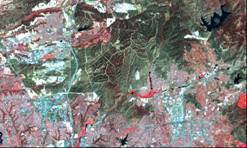
Information products derived from remote sensing and used to assess fire
risk pertain to maps of fire fuel types, fire fuel properties, land use,
and topography. Fire fuels maps portray a combination of vegetation type
and structural characteristics, that may represent or model the fractions
of various fuel components (e.g., leaves, stems, litter, etc.) associated
with different types and ages of vegetation. Such maps are generated by
visual interpretation of high spatial resolution imagery (e.g., color
infrared aerial photographs) or through semi-automated classification
of digital multispectral (i.e., multiple wavelength bands) images captured
by satellites.
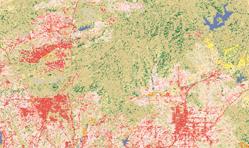
Maps of fuel properties such as biomass and moisture are also derived
from digital multispectral images from satellite or airborne sensors.
But rather than visually interpreting or computer classifying the images,
the maps are normally generated using simple indices derived from the
multispectral data, that are empirically calibrating with field measurements
of the fuel property of interest.
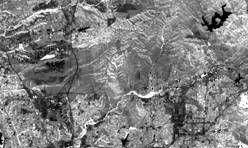
Land use is commonly mapped by visual interpretation of high spatial resolution
images. Land use maps provide spatial information on human activity locations
and proximity of such locations to undeveloped areas that are more prone
to wildfires. More detailed maps of land cover can show whether or not
home owners have created fuel breaks by clearing dense and/or more flammable
vegetation some prescribed distance from their residences.
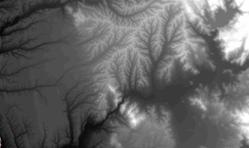
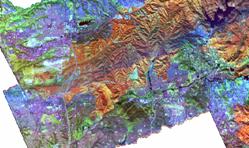
Topographic information, of critical importance to the modeling and prediction of fire spread and risk, is derived from topographic maps or computerized versions of such maps called digital elevation models or digital terrain data. Terrain data (e.g., elevation, slope, and aspect) are generated from a variety of remote sensing approaches that may be based on stereo aerial photographs, scanning laser systems, or specialized radar (microwave) sensors.
Fire Fighting
Real-time imaging of the extent and spread of fires is possible by sensing in longer wavelengths of the electromagnetic spectrum, specifically in the thermal infrared (TIR) or microwave regions. Maps of fire extent and temperature, as well as locations of fire fronts, are generated from TIR imagery captured by airborne scanners. On-board processing of the image data enables maps to be automatically generated and downlinked by microwave transmission to fire command and control centers. Scanning microwave radiometers on aircraft enable imaging in most weather conditions, (whereas thick cloud cover or smoke may obscure TIR sensing), but at a loss in spatial detail and/or extent of coverage. Maps of fire temperature at various stages of a wildfire event may also be useful for assessing the severity of the fire and the likely nature of soil and vegetation recovery. Some satellite imagery captured within visible and other solar-reflective wavelengths can provide region-wide coverage of smoke plumes and information on the extent of smoke transport and ash deposition.
Post-fire Assessments
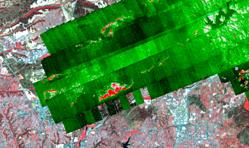
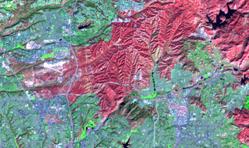
Immediately following a wildfire event, it is important to assess the amount, degree, and location of damage to human-built structures and infrastructure, and the condition of soil and vegetation resources. High spatial resolution images are useful for general post-fire reconnaissance and examination of structural damage. Moderate resolution images from visible and infrared sensors on high altitude aircraft or polar orbiting satellites are used for immediate mapping of fire scar boundaries and preliminary mapping of burn severity. Such maps are used in the field by burn assessment teams that focus on soil conditions and evaluating the need for mitigation of potential soil erosion hazard. Later, more careful mapping of burn severity distribution may be conducted through semi-automated processing of satellite image data, calibrated by the field observations made by burn assessment teams.
For wildfires in remote regions of the world, mostly automated, global
mapping of current fires and fire scars is now conducted with coarse spatial
resolution data from satellite imaging systems. Such maps primarily support
earth system science research on the role of fires in affecting the carbon
and water cycles, rather than local fire management efforts.
Studies of vegetation recovery following fire also tend to be driven by more scientific research pursuits, though studies of short term recovery is important for managing soil erosion. Time-series of Landsat satellite imagery have and can be developed for the past 30 years, and provide the best means for assessing recovery of vegetation from fires in the past half century. High spatial resolution multispectral imagery captured on one or more dates within the first several years following fire can provide useful information the initial re-establishment of vegetation and may enable detection of some erosional or mass wasting features.